RosaBioinfo
Coverage barplot for alignment of Isolate reads on wPipPel regions (WO phage, MLST) and pWCP plasmid
January 15, 2026
Alice Brunner
Language: R
Coverage with bedtools genomecov
bedtools genomecov -ibam ./Data/Isolate1_Map_wPipPel_bowtie2_map.bam -d > ./Data/Coverage_Isolate_against_Pel.txt
You can download Coverage_Isolate_against_Pel.txt here.
The file contains mapping data of Isolate reads on wPipPel and on the pWCP plasmid.
library(dplyr)
##
## Attachement du package : 'dplyr'

## Les objets suivants sont masqués depuis 'package:stats':
##
##     filter, lag

## Les objets suivants sont masqués depuis 'package:base':
##
##     intersect, setdiff, setequal, union
library(ggplot2)
library(ggpubr)
## Registered S3 methods overwritten by 'backports':
##   method                    from
##   as.character.Rconcordance tools
##   print.Rconcordance        tools
library(svglite)

myfiles <- read.table("Data/Coverage_Isolate_against_Pel.txt", skip = "#")
df <- myfiles
Defining wPipPel regions
# 2. Define gene regions ranges
named_ranges_gen <- list(
  "Head region (WOPip1)" = c(254031, 261560),
  "Head region (WOPip2)" = c(327551, 335080),
  "Head region (WOPip3)" = c(346283, 351251),
  "Head region (WOPip4)" = c(452710, 456479),
  "Head region (WOPip5)" = c(1379161, 1387731),
  "Connector region (WOPip1)" = c(250652, 253933),
  "Connector region (WOPip2)" = c(323286, 327551),
  "Connector region (WOPip3)" = c(351349, 355617),
  "Connector region (WOPip4)" = c(448002, 452571),
  "Connector region (WOPip5)" = c(1377110, 1379086),
  "Tail_fiber region (WOPip4)" = c(470102, 477427),
  "Tail_fiber region (WOPip5)" = c(1400753, 1406700),
  "Tail region (WOPip4)" = c(477420, 483289),
  "Tail region (WOPip5)" = c(1406693, 1413160),
   "Octomum_Toxins_1346" = c(1420834, 1432482),
  "Octomum_Transposase_1347" = c(1432713, 1433660),
  "Octomum_Toxins_1348" = c(1433864, 1434331),
  "Octomum_Toxins_1349" = c(1434391, 1439217),
  "Octomum_Transposase_1350" = c(1439977, 1440849),
  "ankyrin_WOPip2_0292" = c(289496, 312651),
  "ankyrin_WOPip2_0293" = c(306739, 312651),
  "ankyrin_WOPip2_0296" = c(317593, 319539),
  "ankyrin_DNAj_WOPip5_1351" = c(1440906, 1444592),
  "cid_A (WOPip1)" = c(287738, 289249),
  "cid_B (WOPip1)" = c(289303, 292827),
  "cin_A (WOPip2)" = c(313400, 314737),
  "cin_B (WOPip2)" = c(314745, 316943),
  "cid_B_trunc (WOPip5, small)" = c(1372563, 1372841),
  "cid_B_trunc (WOPip5, large, DUB)" = c(1371265, 1372326),
  "ftsZ_MLST" = c(623830, 625014),
  "wsp_MLST" = c(1005930, 1006616),
  "gatB_MLST" = c(84405, 85826),
  "coxA_MLST" = c(78172, 79722),
  "fbpA_MLST" = c(1152118, 1153008),
  "wmk_0461" = c(490163,490717),
  "wmk_1344" = c(1419255,1419809),
  "wmk_0290" = c(296912,297466)
)


named_ranges_pWCP <- list(
  "gp11_Plasmid_pWCP" = c(6529, 7239),
  "relB1_Plasmid_pWCP" = c(2165, 2398),
  "dnaB1_Plasmid_pWCP" = c(1382, 1879),
  "parA_Plasmid_pWCP"  = c(5710, 6363)
)
Preparing figure
colnames(df) <- c("genome","pos","cov")
df$pos <- as.integer(df$pos)
df$cov <- as.numeric(df$cov)

mndf <- data.frame(Column1 = character(),
                   Column2 = character(),
                   Column3 = numeric(),
                   stringsAsFactors = FALSE)

# wPipPel
for (nm in names(named_ranges_gen)) {
  rng <- named_ranges_gen[[nm]]; start <- min(rng); end <- max(rng)
  mn <- df %>%
    dplyr::filter(genome == "NC_010981.1", pos >= start, pos <= end) %>%
    summarise(m = mean(cov, na.rm = TRUE)) %>% pull(m)
  mndf <- dplyr::bind_rows(mndf,
    data.frame(Column1="Isolate1", Column2=nm, Column3=mn, stringsAsFactors=FALSE))
}

# Plasmid
for (nm in names(named_ranges_pWCP)) {
  rng <- named_ranges_pWCP[[nm]]; start <- min(rng); end <- max(rng)
  mn <- df %>%
    dplyr::filter(genome == "pWCP", pos >= start, pos <= end) %>%
    summarise(m = mean(cov, na.rm = TRUE)) %>% pull(m)
  mndf <- dplyr::bind_rows(mndf,
    data.frame(Column1="Isolate1", Column2=nm, Column3=mn, stringsAsFactors=FALSE))
}
# 4. Summary
df_summary <- mndf %>%
  group_by(Column2) %>%
  summarize(mean_coverage = mean(Column3, na.rm = TRUE))
# 5. Custom ordering
ordered_regions <- c(names(named_ranges_gen), names(named_ranges_pWCP))
df_summary$Column2 <- factor(df_summary$Column2, levels = ordered_regions)
# 6. Renaming
rename_labels <- c(
  "Head region (WOPip1)" = "Head WOPip1", "Head region (WOPip2)" = "Head WOPip2", "Head region (WOPip3)" = "Head WOPip3",
  "Head region (WOPip4)" = "Head WOPip4", "Head region (WOPip5)" = "Head WOPip5",
  "Connector region (WOPip1)" = "Connector WOPip1", "Connector region (WOPip2)" = "Connector WOPip2",
  "Connector region (WOPip3)" = "Connector WOPip3", "Connector region (WOPip4)" = "Connector WOPip4",
  "Connector region (WOPip5)" = "Connector WOPip5",
  "Tail_fiber region (WOPip4)" = "Tail fiber WOPip4",
  "Tail_fiber region (WOPip5)" = "Tail fiber WOPip5",
   "Tail region (WOPip4)" = "Tail WOPip4", "Tail region (WOPip5)" = "Tail WOPip5",
  "Octomum_Toxins_1346" = "Toxins 1346", "Octomum_Transposase_1347" = "Transposase 1347",
  "Octomum_Toxins_1348" = "Toxins 1348", "Octomum_Toxins_1349" = "Toxins 1349",
  "Octomum_Transposase_1350" = "Transposase 1350",
  "ankyrin_WOPip2_0292" = "0292",
  "ankyrin_WOPip2_0293" = "0293", "ankyrin_WOPip2_0296" = "0296",
  "ankyrin_DNAj_WOPip5_1351" = "1351",
  "cid_A (WOPip1)" = "cifA type I 0282", "cid_B (WOPip1)" = "cifB type I 0283",
  "cin_A (WOPip2)" = "cifA type IV 0294", "cin_B (WOPip2)" = "cifB type IV 0295",
  "cid_B_trunc (WOPip5, small)" = "cifB trunc 1292", "cid_B_trunc (WOPip5, large, DUB)" = "cifB trunc 1291",
  "wmk_0461" = "wmk 0461", "wmk_1344" = "wmk 01344", "wmk_0290" = "wmk 0290",
  "ftsZ_MLST" = "ftsZ", "wsp_MLST" = "wsp", "gatB_MLST" = "gatB",
  "coxA_MLST" = "coxA", "fbpA_MLST" = "fbpA", "gp11_Plasmid_pWCP" = "GP11",
  "relB1_Plasmid_pWCP" = "RelB1", "dnaB1_Plasmid_pWCP" = "Dnab1", "parA_Plasmid_pWCP" = "ParA-like"
)

df_summary$Label <- recode(df_summary$Column2, !!!rename_labels)
Plotting figure
# 7. Insert spacing rows
insert_blank <- function(df, after_rows) {
  for (i in rev(after_rows)) {
    blank <- df[1, ]
    blank$mean_coverage <- 0
    blank$Column2 <- NA
    blank$Label <- paste0("spacer_", i)
    df <- add_row(df, .before = i + 1, !!!blank)
  }
  return(df)
}

df_summary <- df_summary %>%
  arrange(factor(Column2, levels = ordered_regions)) %>%
  insert_blank(after_rows = c(5, 10, 12, 14, 19, 23, 29, 34, 37))

# 8. Convert to factor
df_summary$Label <- factor(df_summary$Label, levels = unique(df_summary$Label))
df_summary$Position <- as.numeric(df_summary$Label)

# 9. Group brackets
brackets_df <- data.frame(
  xmin = c(1, 7, 13, 16, 19, 25, 30, 37, 42, 48),
  xmax = c(5, 11, 14, 17, 23, 28, 35, 41, 45, 49),
  label = c("Head", "Connector", "Tail\nfiber", "Tail", "Octomum", "Ankyrin", "bolditalic('cif')", "bolditalic('wmk')", "MLST/ Genome", "pWCP")
)

italic_genes <- c("ftsZ", "wsp", "gatB", "coxA", "fbpA", "GP11", "RelB1", "Dnab1", "ParA-like")
custom_labels <- function(x) {
  sapply(x, function(label) {
    if (grepl("^spacer_", label)) return("")
    if (label %in% italic_genes) return(bquote(italic(.(label))))
    else return(label)
  })
}

# 11. Plot
max_y <- max(df_summary$mean_coverage, na.rm = TRUE)
bracket_y <- 1.45 * max_y

p <- ggplot(df_summary, aes(x = Label, y = mean_coverage, fill = Column2)) +
  geom_bar(stat = "identity") +
  scale_fill_manual(values = c(
    rep("#660066", 5), rep("#0432ff", 5), rep("#ffc1c0", 2), rep("#ff6666", 2),
    rep("#ff6600", 5), rep("#ff0000", 4), rep("#ffa4ff", 6), rep("grey30", 5), rep("grey20", 3), rep("grey10", 4)
  ), na.value = "white") +
  scale_x_discrete(
    expand = expansion(mult = c(0.01, 0.01)),
    labels = custom_labels
  ) +
  labs(x = "Genes/ Regions", y = "Mean Coverage") +
  theme_minimal() +
  theme(
    panel.grid = element_blank(),
    axis.text.x = element_text(size = 7, angle = 90, vjust = 1, hjust = 1),
    legend.position = "none"
  )

for (i in 1:nrow(brackets_df)) {
  text_y <- if (brackets_df$label[i] == "Tail\nfiber") {
    bracket_y + 0.065 * max_y
  } else {
    bracket_y + 0.035 * max_y
  }

  label_text <- brackets_df$label[i]

  p <- p +
    annotate("segment", x = brackets_df$xmin[i], xend = brackets_df$xmax[i],
             y = bracket_y, yend = bracket_y, size = 0.6)

  if (grepl("italic", label_text)) {
    p <- p +
      annotate("text", x = mean(c(brackets_df$xmin[i], brackets_df$xmax[i])),
               y = text_y, label = label_text, size = 5, parse = TRUE)
  } else {
    p <- p +
      annotate("text", x = mean(c(brackets_df$xmin[i], brackets_df$xmax[i])),
               y = text_y, label = label_text, size = 5, fontface = "bold")
  }
}
## Warning: Using `size` aesthetic for lines was deprecated in ggplot2 3.4.0.
## ℹ Please use `linewidth` instead.
## This warning is displayed once every 8 hours.
## Call `lifecycle::last_lifecycle_warnings()` to see where this warning was
## generated.
print(p)
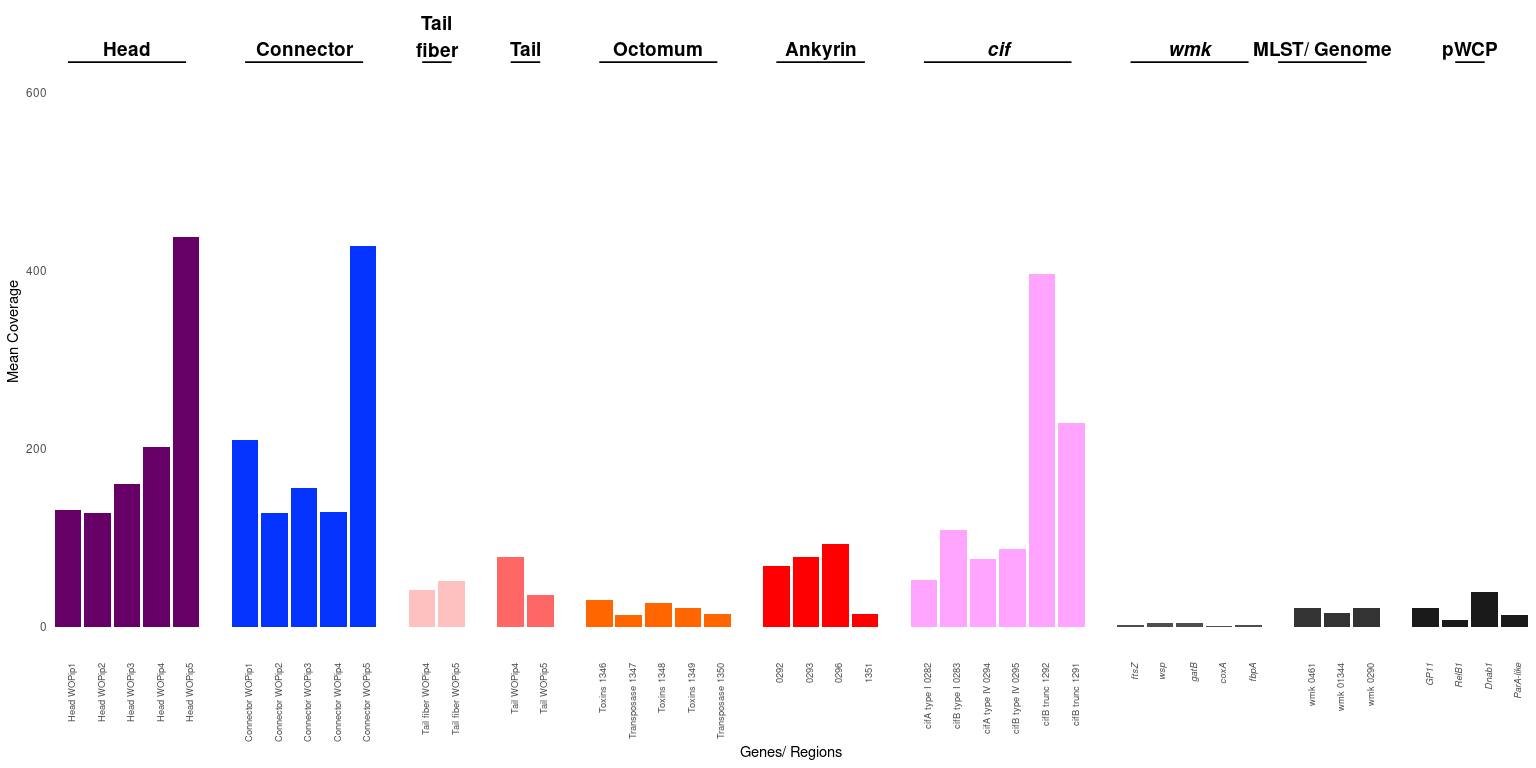
# SVG export
ggsave(
  filename = "Figures/Plot_cov_c.svg",
  plot = p,
  device = svglite::svglite,
  width = 180, height = 120, units = "mm"
)