RosaBioinfo
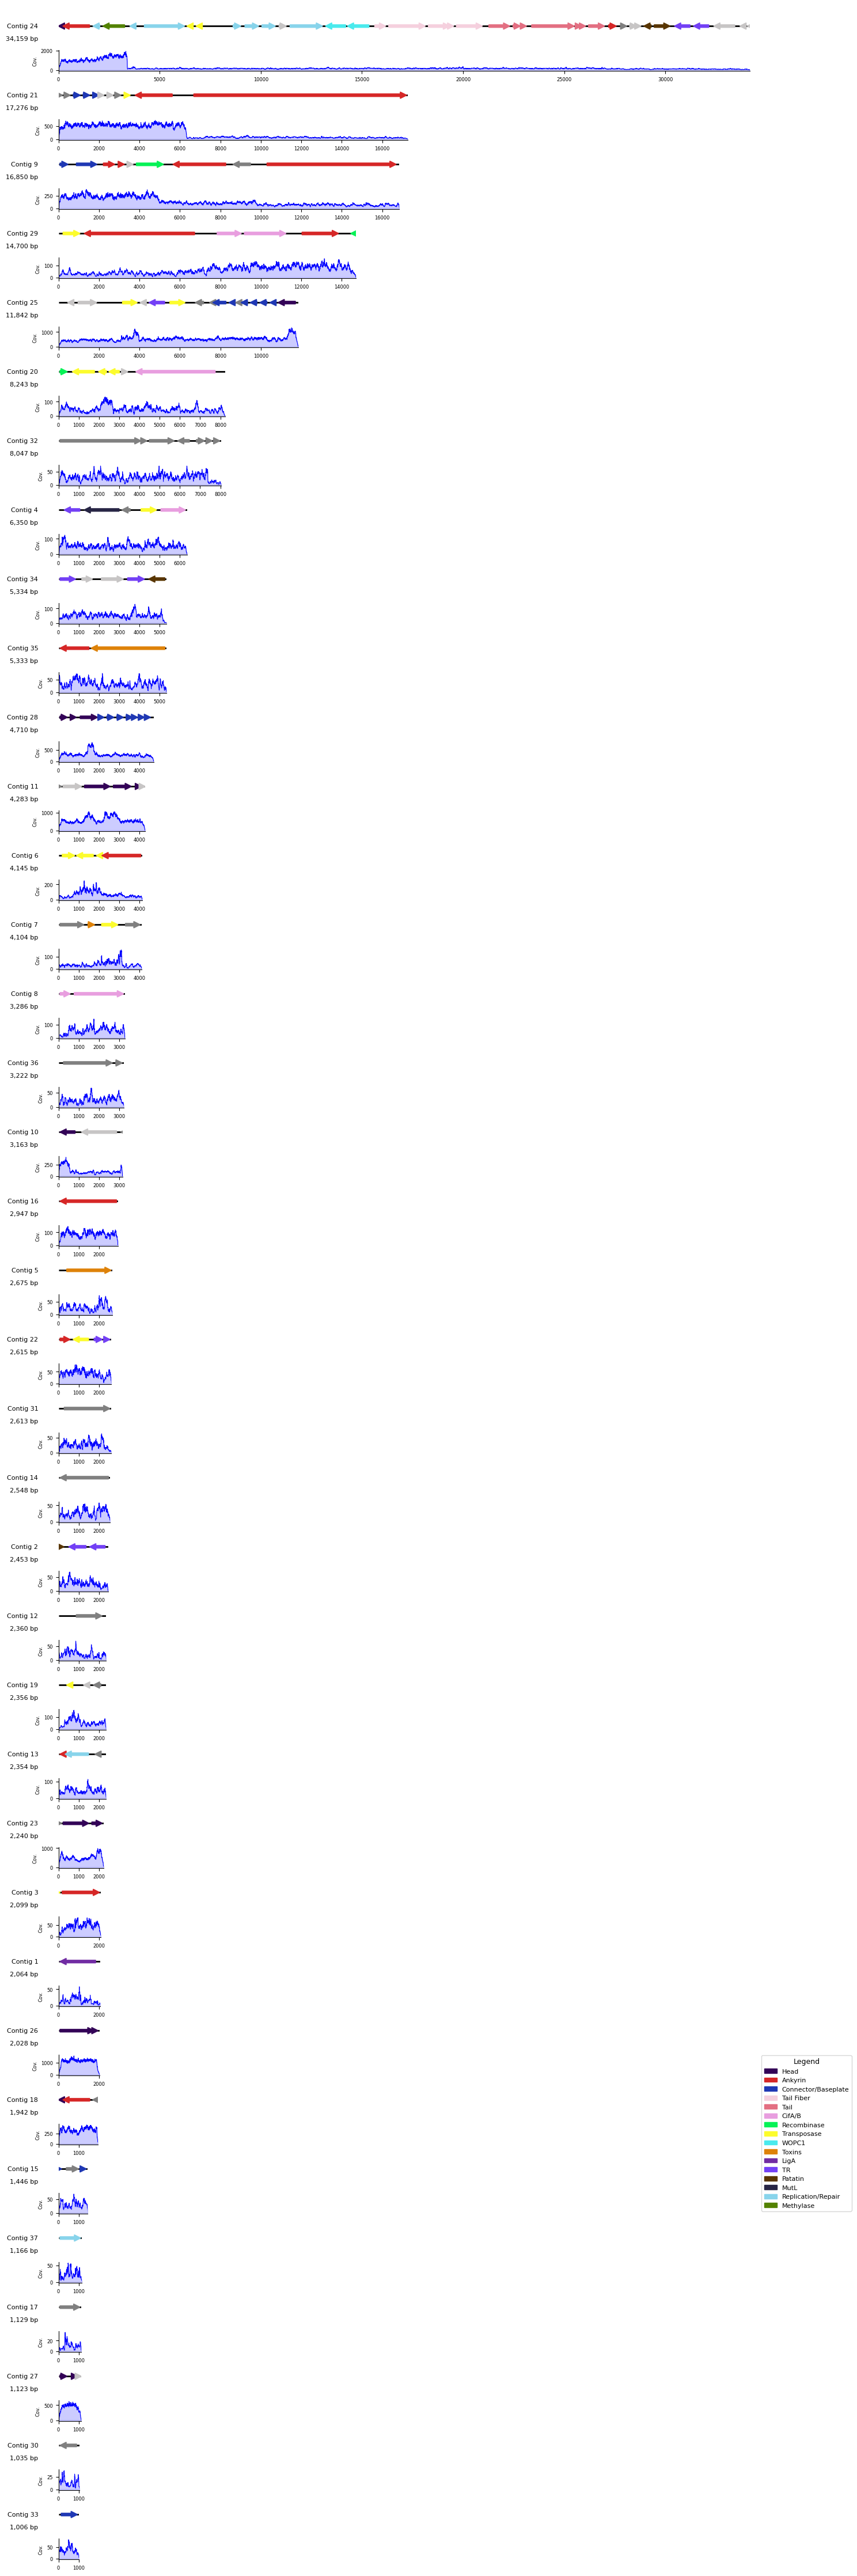
Coverage visualization of alignment of Isolate reads on Isolate assembly
January 16, 2026
Alice Brunner
Language: Python
#!pip3 install pandas openpyxl
# Assembly synteny + coverage figure
import pandas as pd # pandas 1.5.3 # numpy backend 1.26.0
import matplotlib.pyplot as plt
import matplotlib.patches as mpatches
from matplotlib.patches import FancyArrowPatch
from Bio import SeqIO
import os
import re
The following input is required: Data/Coverage_Isolate_against_Isolate.txt.gz
# Generate folder of per-contig coverage
df = pd.read_csv('Data/Coverage_Isolate_against_Isolate.txt', sep='\t', header=None)

os.makedirs('Data/contigs_coverage', exist_ok=True)

l = list(df[0].unique())
d = {k: f'contig_{(i+1):02d}' for i, k in enumerate(l) }

for f in l:
    a = df.loc[df[0] == f]
    a[0] = d[f]
    a.to_csv(f'Data/contigs_coverage/{d[f]}_contigcov_dataframe.csv')
/tmp/ipykernel_787645/3375605565.py:10: SettingWithCopyWarning:
A value is trying to be set on a copy of a slice from a DataFrame.
Try using .loc[row_indexer,col_indexer] = value instead

See the caveats in the documentation: https://pandas.pydata.org/pandas-docs/stable/user_guide/indexing.html#returning-a-view-versus-a-copy
  a[0] = d[f]
The following inputs are required:
- Data/isolat_gff.xlsx - Gene calling of Isolate.fasta
- Data/Orthogroups_isolate.tsv - Orthofinder launched against Wolbachia genes database launched on Isolate CDS
- Data/formatted-Wolbachia-contigs.fa - Isolate.fasta sequence - all contigs
- Data/contigs_coverage.zip - Coverage of Isolate reads on all Isolate contigs - one file by contig - zip file must be unzipped into a folder
# === Parameters ===
gff_path = "Data/isolat_gff.xlsx"
orthogroups_path = "Data/Orthogroups_isolate.tsv"
fasta_path = "Data/formatted-Wolbachia-contigs.fa"
coverage_folder = "Data/contigs_coverage"
output_path = "Output/synteny_with_coverage.pdf"
output_path_png = "Figures/synteny_with_coverage.png"
# === Load data ===
df = pd.read_excel(gff_path)
orthogroups_df = pd.read_csv(orthogroups_path, sep="\t")
df.columns = [col.strip().lower() for col in df.columns]
df['protein_id'] = df['proteines'].str.extract(r'___(\d+)$')[0]

# === Annotation dictionary ===
protein_function_map = {}
for _, row in orthogroups_df.iterrows():
    if pd.notna(row['PROTEINS']):
        for pid in row['PROTEINS'].split(','):
            protein_function_map[pid.strip()] = str(row['WOqueries_041124'])

# === Color assignment function ===
def get_color(annotations):
    if annotations is None:
        return 'grey'
    annotations = annotations.split(",")
    # Default: first annotation in the list (comma-separated)
    annotation = annotations[0]
    for a in annotations:
        # Prioritize cif annotations over other functional labels
        if "cif" in a:
            annotation = a
    a = annotation
    return {
        'HEAD': '#330357', 'ANK': '#d62727', 'CON_': '#1f38b4', 'TailFiber': '#f5d0de',
        'Tail_': '#e36f82', 'RECOMB': '#07f256', 'LIGA': '#712ca3', 'TOXIN': '#de8209',
        'WOPC1': '#4aeaed', 'cifA': '#e89edf', 'cifB': '#e89edf', 'TR': '#7340f5',
        'PATATIN': '#593601', 'TNP': '#fcfc2d', 'MutL': '#272545', 'METHYL': '#538201',
        'REP': '#88d4eb'
    }.get(
        next((k for k in [
            'HEAD','ANK','CON_','TailFiber','Tail_','RECOMB','LIGA','TOXIN','WOPC1','cifA','cifB',
            'TR','PATATIN','TNP','MutL','METHYL','REP'
        ] if k in a), None),
        '#c7c5c5'
    )

# === Contig lengths from FASTA ===

fasta_dico = {f'c_0000000000{(i+1):02d}': len(record.seq) for i, record in enumerate(SeqIO.parse(fasta_path, "fasta"))}
unique_contigs = sorted(df['contigs'].unique(), key=lambda x: fasta_dico.get(x, 0), reverse=True)
max_len = max(fasta_dico.values())

# === Prepare combined figure ===
fig = plt.figure(figsize=(15, len(unique_contigs) * 2))
y_step = 0.60 / len(unique_contigs)
y_height_syn = y_step * 0.6
y_height_cov = y_step * 0.3
y_margin = y_step * 0.05

for idx, contig in enumerate(unique_contigs):
    subset = df[df['contigs'] == contig]
    contig_len = fasta_dico.get(contig, subset['fin'].max())
    width_ratio = contig_len / max_len
    match = re.search(r'(\d+)$', contig)
    display_name = f"Contig {int(match.group(1))}" if match else contig
    y_base = 1 - (idx + 1) * y_step

    # True contig length (from FASTA)
    contig_length = fasta_dico.get(contig, subset['fin'].max())  # fallback if contig not found in FASTA

    # --- Synteny ---
    ax_syn = fig.add_axes([0.1, y_base + y_height_cov + y_margin, 0.8 * width_ratio, y_height_syn])
    ax_syn.set_xlim(0, contig_len)
    ax_syn.set_ylim(-1, 1)
    ax_syn.axis('off')
    ax_syn.text(-1000, 0, display_name, ha='right', va='center', fontsize=8)
    ax_syn.hlines(0, 0, contig_len, color='black', linewidth=2, zorder=0)

    # Display contig length on the right
    ax_syn.text(-1000, -0.6, f"{contig_length:,} bp", va='center', ha='right', fontsize=8, color='black')

    for _, row in subset.iterrows():
        start, end = row['deb'], row['fin']
        direction = row['sens']
        prot_id = str(row['protein_id'])
        annotation = protein_function_map.get(prot_id)
        color = get_color(annotation)
        arrow = (
            FancyArrowPatch((start, 0), (end, 0), arrowstyle='simple', color=color,
                            mutation_scale=15, linewidth=1.5)
            if direction == '+'
            else FancyArrowPatch((end, 0), (start, 0), arrowstyle='simple', color=color,
                                 mutation_scale=15, linewidth=1.5)
        )
        ax_syn.add_patch(arrow)

    # --- Coverage ---
    ax_cov = fig.add_axes([0.1, y_base, 0.8 * width_ratio, y_height_cov])
    filename = f"contig_{int(match.group(1)):02d}_contigcov_dataframe.csv"
    cov_path = os.path.join(coverage_folder, filename)
    if os.path.exists(cov_path):
        df_cov = pd.read_csv(cov_path, header=0, names=["contig", "position", "coverage"]).reset_index(drop=True)
        df_cov = df_cov.dropna()
        df_cov["position"] = pd.to_numeric(df_cov["position"], errors='coerce')
        df_cov["coverage"] = pd.to_numeric(df_cov["coverage"], errors='coerce')
        ax_cov.plot(df_cov["position"], df_cov["coverage"], color='blue', linewidth=0.7)
        ax_cov.fill_between(df_cov["position"], 0, df_cov["coverage"], color='blue', alpha=0.2)
        ax_cov.set_xlim(0, contig_len)
        ax_cov.set_ylabel("Cov.", fontsize=6)
        ax_cov.tick_params(axis='both', labelsize=6)
        ax_cov.spines['top'].set_visible(False)
        ax_cov.spines['right'].set_visible(False)
    else:
        ax_cov.axis('off')
        ax_cov.text(0, 0.5, 'Coverage missing', fontsize=6)

# === Define legend elements ===
legend_elements = [
    mpatches.Patch(color='#330357', label='Head'),
    mpatches.Patch(color='#d62727', label='Ankyrin'),
    mpatches.Patch(color='#1f38b4', label='Connector/Baseplate'),
    mpatches.Patch(color='#f5d0de', label='Tail Fiber'),
    mpatches.Patch(color='#e36f82', label='Tail'),
    mpatches.Patch(color='#e89edf', label='CifA/B'),
    mpatches.Patch(color='#07f256', label='Recombinase'),
    mpatches.Patch(color='#fcfc2d', label='Transposase'),
    mpatches.Patch(color='#4aeaed', label='WOPC1'),
    mpatches.Patch(color='#de8209', label='Toxins'),
    mpatches.Patch(color='#712ca3', label='LigA'),
    mpatches.Patch(color='#7340f5', label='TR'),
    mpatches.Patch(color='#593601', label='Patatin'),
    mpatches.Patch(color='#272545', label='MutL'),
    mpatches.Patch(color='#88d4eb', label='Replication/Repair'),
    mpatches.Patch(color='#538201', label='Methylase')
]

# === Add legend on the right ===
fig.legend(handles=legend_elements, loc='center left', bbox_to_anchor=(0.91, 0.5),
           title="Legend", fontsize=8, title_fontsize=9)

# === Export final figure ===
fig.savefig(output_path, bbox_inches='tight')
fig.savefig(output_path_png, bbox_inches='tight')
plt.close(fig)
print("Figure saved:", output_path)
Figure saved: Output/synteny_with_coverage.pdf