RosaBioinfo
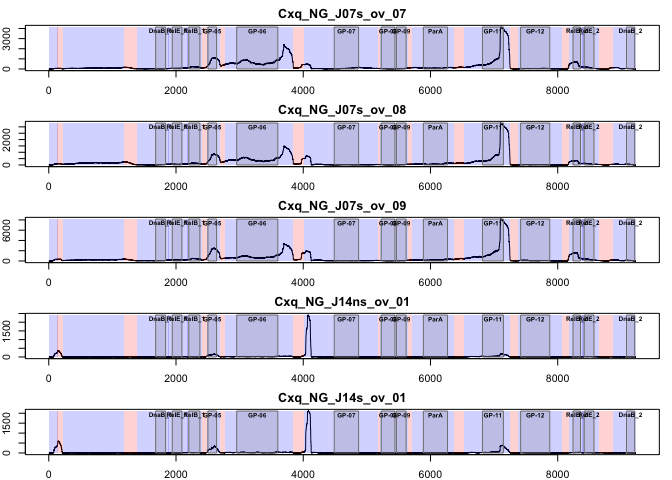
RNASeq coverage profiles of pWCP plasmid expression in Wolbachia endosymbiont of Culex
Mateo Jarry
2026-01-22
- Obtain RNA coverage information on the pWCP plasmid from our whole-genome alignments
- Data loading
- Coverage profiles with genes, intergenic regions and qPCR amplicons for all transcriptomes
Obtain RNA coverage information on the pWCP plasmid from our whole-genome alignments
This notebook needs in input “Data/coverage/” (get here).
We extracted coverage values for each of the deduplicated .bam files
(UMI-unique) using bedtools.
for f in deduplicated*.bam; do
  bedtools genomecov -ibam $f -d > ./Data/coverage/Coverage_$f.txt
done
Data loading
library(dplyr)
##
## Attaching package: 'dplyr'

## The following objects are masked from 'package:stats':
##
##     filter, lag

## The following objects are masked from 'package:base':
##
##     intersect, setdiff, setequal, union
setwd('./Data/coverage/')
temp <- list.files(pattern = glob2rx("Coverage*NG*.txt"), full.names=T)
myfiles <- lapply(temp, read.table, skip = "#")
myfiles <- lapply(myfiles, function(x) filter(x, x$V1=='pWCP')) # plasmid
names(myfiles) <- temp
Coverage profiles with genes, intergenic regions and qPCR amplicons for all transcriptomes
intergenic_ranges <- list(
  c(134, 230), c(1179, 1385), c(2403, 2485), c(2696, 2764),
  c(3839, 4014), c(5170, 5213), c(5647, 5713), c(6368, 6532),
  c(7244, 7371), c(8065, 8175), c(8649, 8863)
)
names(intergenic_ranges) <- c("IG-1", "IG-2", "IG-3", "IG-4", "IG-5",
                              "IG-6", "IG-7", "IG-8", "IG-9", "IG-10", "IG-11")
coding_ranges <- list(
 c(1,143), c(231,1179), c(1386,1884), c(1880,2189), c(2169,2403), c(2486,2696), c(2765,3839), c(4015,5170),
           c(5214,5475), c(5455,5647), c(5714,6368), c(6533,7244), c(7372,8065), c(8176,8407), c(8382,8649), c(8864,9228)  # Adjust based on real coding regions
)
names(coding_ranges) <- c("DnaB_2b", "IS110", "DnaB_1", "RelE_1", "RelB_1", "GP-05", "GP-06", "GP-07","GP-08", "GP-09", "ParA", "GP-11", "GP-12", "RelB_2", "RelE_2", "DnaB_2a")

amplicons_ranges <- list(
  c(9081,9209), c(1680,1836), c(1941,2093), c(2201,2375), c(2501,2638), c(2954,3600), c(4487,4870), c(5226,5441), c(5464,5617), c(5888,6268), c(6817,7146), c(7417,7875), c(8240,8358), c(8416,8570)
)
names(amplicons_ranges) <- c("DnaB_2", "DnaB_1", "RelE_1", "RelB_1", "GP-05", "GP-06", "GP-07","GP-08", "GP-09", "ParA", "GP-11", "GP-12", "RelB_2", "RelE_2")
plotrange <- function(myfiles, range, coding_ranges, intergenic_ranges, amplicons_ranges,
                      genome_length = 9228, main_from_name_parts = 3:7) {
  # Set multi-panel layout; cap rows to a reasonable number
  n_panels <- length(range)
  par(mfrow = c(n_panels, 1), mar = c(2, 2, 2, 1), oma = c(0, 0, 0, 0))

  # Helper: draw a (start, end) interval, allowing wrap-around
  draw_interval <- function(start, end, y_max, col, border, lwd) {
    # Normalize into [1, genome_length]
    if (is.na(start) || is.na(end)) return(invisible(NULL))
    # If interval wraps around (end < start), draw two parts
    if (end < start) {
      rect(1, 0, end, y_max, col = col, border = border, lwd = lwd)
      rect(start, 0, genome_length, y_max, col = col, border = border, lwd = lwd)
    } else {
      rect(start, 0, end, y_max, col = col, border = border, lwd = lwd)
    }
  }

  # Iterate over requested indices
  for (i in range) {
    # Defensive checks
    if (i < 1 || i > length(myfiles)) {
      plot.new(); title(main = paste("Index", i, "out of bounds"))
      next
    }

    df <- myfiles[[i]]
    # Coerce to numeric safely
    x <- suppressWarnings(as.numeric(df$V2))
    y <- suppressWarnings(as.numeric(df$V3))

    # Remove non-finite rows
    keep <- is.finite(x) & is.finite(y)
    x <- x[keep]; y <- y[keep]

    # If empty after cleaning, skip with a message
    if (length(x) == 0 || length(y) == 0) {
      plot.new(); title(main = paste("No finite data for index", i))
      next
    }

    # Titles from filename parts
    main_title <- NA
    nm <- names(myfiles)[i]
    if (!is.null(nm)) {
      split_string <- strsplit(nm, "_")[[1]]
      if (length(split_string) >= max(main_from_name_parts)) {
        main_title <- paste(split_string[main_from_name_parts], collapse = "_")
      } else {
        main_title <- nm
      }
    } else {
      main_title <- paste("Series", i)
    }

    # Plot limits
    x_min <- max(1, min(x, na.rm = TRUE))
    x_max <- min(genome_length, max(x, na.rm = TRUE))
    y_max <- max(y, na.rm = TRUE)
    y_min <- min(y, na.rm = TRUE)
    if (!is.finite(x_min) || !is.finite(x_max) || x_min == x_max) {
      # Fall back to genome range if x collapsed
      x_min <- 1; x_max <- genome_length
    }
    if (!is.finite(y_max) || y_max <= 0) {
      # Fall back to a small range if y is degenerate
      y_max <- 1
    }
    ylim <- c(0, y_max)
    xlim <- c(x_min, x_max)

    # Plot main line
    plot(x, y, type = "l", xlim = xlim, ylim = ylim,
         main = main_title, xlab = "", ylab = "", col = "black")

    # --- Shaded regions: coding (blue, semi-transparent)
    for (j in seq_along(coding_ranges)) {
      cr <- coding_ranges[[j]]
      if (length(cr) == 2 && all(is.finite(cr))) {
        draw_interval(cr[1], cr[2], y_max, col = rgb(0, 0, 1, 0.18), border = NA, lwd = 1)
      }
    }

    # --- Shaded regions: intergenic (red, semi-transparent)
    for (j in seq_along(intergenic_ranges)) {
      ir <- intergenic_ranges[[j]]
      if (length(ir) == 2 && all(is.finite(ir))) {
        draw_interval(ir[1], ir[2], y_max, col = rgb(1, 0, 0, 0.18), border = NA, lwd = 1)
      }
    }

    # --- Amplicon boxes (subtle grey with label)
    for (j in seq_along(amplicons_ranges)) {
      ar <- amplicons_ranges[[j]]
      if (length(ar) == 2 && all(is.finite(ar))) {
        draw_interval(ar[1], ar[2], y_max, col = rgb(0, 0, 0, 0.1), border = "grey50", lwd = 1)
        # Place label at mid of the (non-wrapped) interval if inside xlim
        start <- ar[1]; end <- ar[2]
        if (end >= start) {
          xm <- (start + end) / 2
          if (xm >= xlim[1] && xm <= xlim[2]) {
            text(xm, y_max * 0.9, labels = names(amplicons_ranges)[j],
                 col = "black", cex = 0.6, font = 2)
          }
        } else {
          # For wrapped intervals, put two labels near both halves
          xm1 <- (1 + end) / 2
          xm2 <- (start + genome_length) / 2
          text(xm1, y_max * 0.9, labels = names(amplicons_ranges)[j],
               col = "black", cex = 0.6, font = 2)
          text(xm2, y_max * 0.9, labels = names(amplicons_ranges)[j],
               col = "black", cex = 0.6, font = 2)
        }
      }
    }
  }
}
plotrange(myfiles, 1:5, coding_ranges, intergenic_ranges, amplicons_ranges, genome_length = 9228)
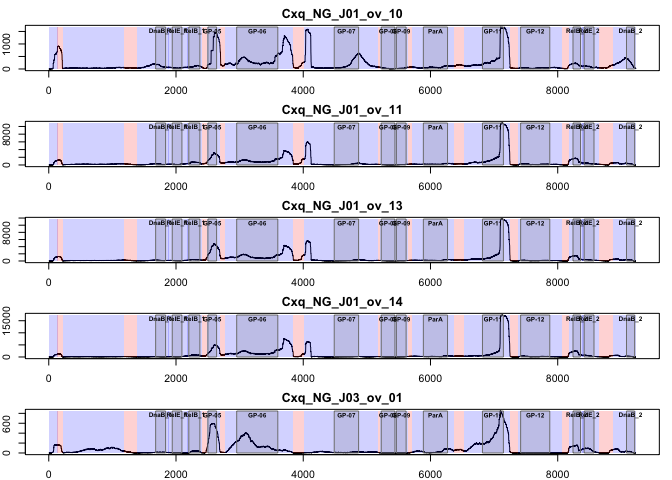
plotrange(myfiles, 6:10, coding_ranges, intergenic_ranges, amplicons_ranges, genome_length = 9228)
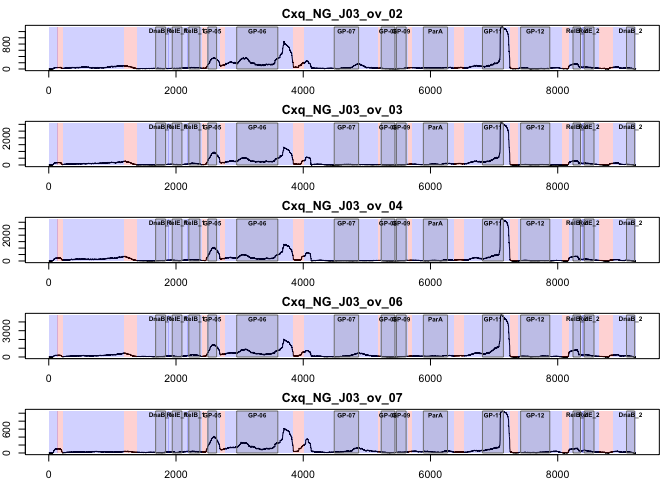
plotrange(myfiles, 11:15, coding_ranges, intergenic_ranges, amplicons_ranges, genome_length = 9228)
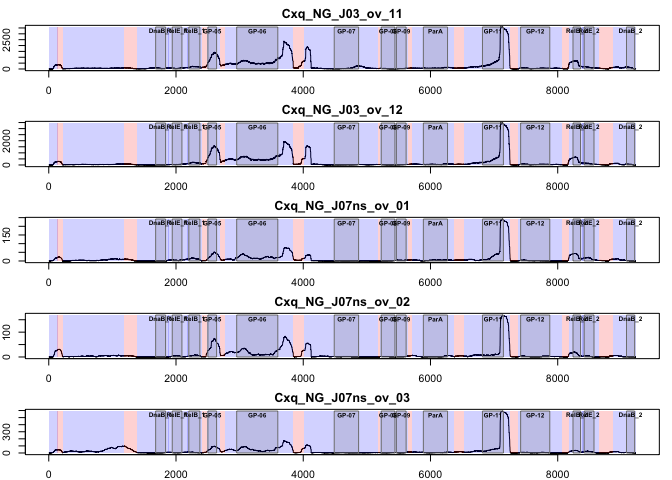
plotrange(myfiles, 16:20, coding_ranges, intergenic_ranges, amplicons_ranges, genome_length = 9228)
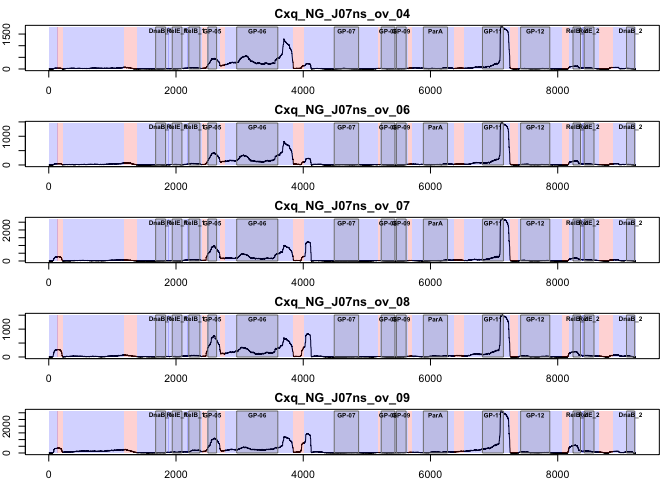
plotrange(myfiles, 21:25, coding_ranges, intergenic_ranges, amplicons_ranges, genome_length = 9228)
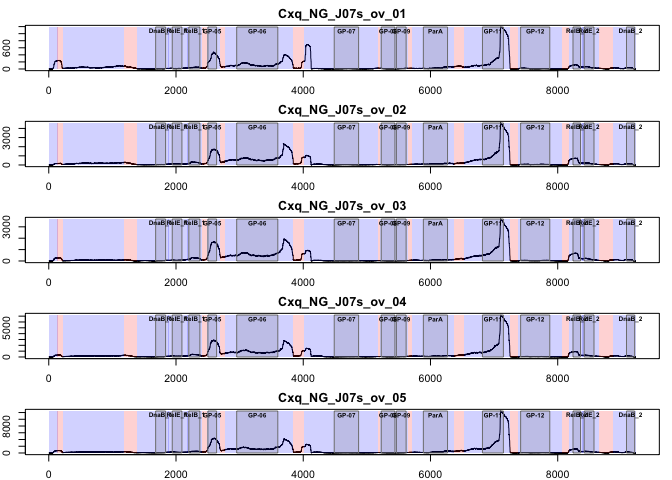
plotrange(myfiles, 26:30, coding_ranges, intergenic_ranges, amplicons_ranges, genome_length = 9228)