RosaBioinfo
Estimation of phage region copy number based on the pangenome
Maxime Mahout
August 27, 2025
- Data Loading and Preprocessing
- Extracting, Selecting and Exporting Longest WO Sequences of CelG
- Mapping Reads to Sequences and Calculating Coverage
- Regression Analysis: Coverage vs. Copy Number
- Functional Annotation and Grouping
- Visualization of Gene Function Coverage and Copy Number
This notebook analyzes gene clusters associated with WO phage regions in Wolbachia, focusing on PipCelG sample, through a comparative coverage/copy number analysis. It includes data loading, annotation, regression modeling, and visualization of gene functions.
An anvi’o pangenome is generated with anvi’o for genomes wPipCelG, wPipPel, wPipJHB, and wPipMol, and visualized using the following commands; the anvi’o pangenome visualization allows us to download the gene clusters summary file used in the following.
anvi-pan-genome --mcl-inflation 10 --use-ncbi-blast -g PIP-GENOMES.db -n PIP_PAN -T 4
anvi-display-pan -p PIP_PAN/PIP_PAN-PAN.db -g PIP-GENOMES.db
Required input file: PAN_FULL_gene_clusters_summary.txt
1. Data Loading and Preprocessing
Data is loaded from the pangenome analysis of wPipCelG and other wPip genomes performed prior to this notebook.
# Import pandas library for data manipulation
import pandas
# Read the gene cluster summary file into a DataFrame
df = pandas.read_csv('PAN_FULL_gene_clusters_summary.txt', sep='\t', index_col=0)
# Display the DataFrame
df
| gene_cluster_id | bin_name | genome_name | gene_callers_id | num_genomes_gene_cluster_has_hits | num_genes_in_gene_cluster | max_num_paralogs | SCG | functional_homogeneity_index | geometric_homogeneity_index | combined_homogeneity_index | COG20_FUNCTION_ACC | COG20_FUNCTION | COG20_CATEGORY_ACC | COG20_CATEGORY | aa_sequence | |
|---|---|---|---|---|---|---|---|---|---|---|---|---|---|---|---|---|
| unique_id | ||||||||||||||||
| 1 | GC_00000001 | WO | CelG3 | 30 | 7 | 163 | 54 | 0 | 0.993841 | 0.909133 | 0.949602 | COG3293 | Transposase | X | Mobilome: prophages, transposons | MKKDITELYCCVEDFCRAVDDNFANRFLSNGKKPTRVPEIAHSEIL... |
| 2 | GC_00000001 | WO | CelG3 | 60 | 7 | 163 | 54 | 0 | 0.993841 | 0.909133 | 0.949602 | COG3293 | Transposase | X | Mobilome: prophages, transposons | MKKDITELYCCVEDFCRAVDDNFANRFLSNGKKPTRVPEIAHSEIL... |
| 3 | GC_00000001 | WO | CelG3 | 79 | 7 | 163 | 54 | 0 | 0.993841 | 0.909133 | 0.949602 | COG3293 | Transposase | X | Mobilome: prophages, transposons | MKKDITELYCCVEDFCRAVDDNFANRFLSNGKKPTRVPEIAHSEIL... |
| 4 | GC_00000001 | WO | CelG3 | 98 | 7 | 163 | 54 | 0 | 0.993841 | 0.909133 | 0.949602 | COG3293 | Transposase | X | Mobilome: prophages, transposons | MKKDITELYCCVEDFCRAVDDNFANRFLSNGKKPTRVPEIAHSEIL... |
| 5 | GC_00000001 | WO | CelG3 | 146 | 7 | 163 | 54 | 0 | 0.993841 | 0.909133 | 0.949602 | COG3293 | Transposase | X | Mobilome: prophages, transposons | MKKDITELYCCVEDFCRAVDDNFANRFLSNGKKPTRVPEIAHSEIL... |
| ... | ... | ... | ... | ... | ... | ... | ... | ... | ... | ... | ... | ... | ... | ... | ... | ... |
| 5918 | GC_00001162 | Possible_WO | CelG3 | 1447 | 1 | 1 | 1 | 0 | 1.000000 | 1.000000 | 1.000000 | NaN | NaN | NaN | NaN | MNRSLEEIKALVIDRIETPFTTWWRVLQK |
| 5919 | GC_00001163 | Possible_WO | CelG3 | 494 | 1 | 1 | 1 | 0 | 1.000000 | 1.000000 | 1.000000 | COG5462 | Predicted secreted (periplasmic) protein | S | Function unknown | MRTFHAISIIIXFIVGLFKVKLHVQSLNRELAXIKHKINLVQSDIK... |
| 5920 | GC_00001164 | NaN | PipMol | 995 | 1 | 1 | 1 | 0 | 1.000000 | 1.000000 | 1.000000 | COG2801 | Transposase InsO and inactivated derivatives (... | X | Mobilome: prophages, transposons | MDSKVKLRLNWVNLYKKLGHAGRVCQHYNISRFTLRKWCKRYKEFG... |
| 5921 | GC_00001165 | NaN | PipJHB | 139 | 1 | 1 | 1 | 0 | 1.000000 | 1.000000 | 1.000000 | NaN | NaN | NaN | NaN | MLFLHPLQQTKSTPAEKTFQLHIKGNDICVNGIGVIETQSKSGRIF... |
| 5922 | GC_00001166 | NaN | PipJHB | 41 | 1 | 1 | 1 | 0 | 1.000000 | 1.000000 | 1.000000 | NaN | NaN | NaN | NaN | MLQRSLEIILYAELYFSSHHSQLDLKYYVHFQYWALVQDHQQENYL... |
5922 rows × 16 columns
Filtering for WO Phage Regions
# Filter rows where 'genome_name' contains 'WO'
df_interest = df.loc[df['genome_name'].str.contains('WO')]
# Get unique gene cluster IDs from filtered DataFrame
gcs = df_interest['gene_cluster_id'].unique().tolist()
# Count unique gene clusters in filtered DataFrame
len(df_interest['gene_cluster_id'].unique())
117
# Filter DataFrame to keep only rows with gene clusters of interest
df_interest = df.loc[df['gene_cluster_id'].isin(gcs)]
Sequence Length Calculation
# Calculate amino acid sequence length (excluding '-') and add as a new column
df_interest['length'] = df_interest['aa_sequence'].apply(lambda x: len(x.replace('-', '')))
/tmp/ipykernel_638449/1892953739.py:2: SettingWithCopyWarning:
A value is trying to be set on a copy of a slice from a DataFrame.
Try using .loc[row_indexer,col_indexer] = value instead

See the caveats in the documentation: https://pandas.pydata.org/pandas-docs/stable/user_guide/indexing.html#returning-a-view-versus-a-copy
  df_interest['length'] = df_interest['aa_sequence'].apply(lambda x: len(x.replace('-', '')))
# Display the filtered DataFrame with length column
df_interest
| gene_cluster_id | bin_name | genome_name | gene_callers_id | num_genomes_gene_cluster_has_hits | num_genes_in_gene_cluster | max_num_paralogs | SCG | functional_homogeneity_index | geometric_homogeneity_index | combined_homogeneity_index | COG20_FUNCTION_ACC | COG20_FUNCTION | COG20_CATEGORY_ACC | COG20_CATEGORY | aa_sequence | length | |
|---|---|---|---|---|---|---|---|---|---|---|---|---|---|---|---|---|---|
| unique_id | |||||||||||||||||
| 1 | GC_00000001 | WO | CelG3 | 30 | 7 | 163 | 54 | 0 | 0.993841 | 0.909133 | 0.949602 | COG3293 | Transposase | X | Mobilome: prophages, transposons | MKKDITELYCCVEDFCRAVDDNFANRFLSNGKKPTRVPEIAHSEIL... | 290 |
| 2 | GC_00000001 | WO | CelG3 | 60 | 7 | 163 | 54 | 0 | 0.993841 | 0.909133 | 0.949602 | COG3293 | Transposase | X | Mobilome: prophages, transposons | MKKDITELYCCVEDFCRAVDDNFANRFLSNGKKPTRVPEIAHSEIL... | 290 |
| 3 | GC_00000001 | WO | CelG3 | 79 | 7 | 163 | 54 | 0 | 0.993841 | 0.909133 | 0.949602 | COG3293 | Transposase | X | Mobilome: prophages, transposons | MKKDITELYCCVEDFCRAVDDNFANRFLSNGKKPTRVPEIAHSEIL... | 290 |
| 4 | GC_00000001 | WO | CelG3 | 98 | 7 | 163 | 54 | 0 | 0.993841 | 0.909133 | 0.949602 | COG3293 | Transposase | X | Mobilome: prophages, transposons | MKKDITELYCCVEDFCRAVDDNFANRFLSNGKKPTRVPEIAHSEIL... | 290 |
| 5 | GC_00000001 | WO | CelG3 | 146 | 7 | 163 | 54 | 0 | 0.993841 | 0.909133 | 0.949602 | COG3293 | Transposase | X | Mobilome: prophages, transposons | MKKDITELYCCVEDFCRAVDDNFANRFLSNGKKPTRVPEIAHSEIL... | 290 |
| ... | ... | ... | ... | ... | ... | ... | ... | ... | ... | ... | ... | ... | ... | ... | ... | ... | ... |
| 5799 | GC_00001099 | WO | PipPel | 1306 | 3 | 3 | 1 | 0 | 1.000000 | 1.000000 | 1.000000 | NaN | NaN | NaN | NaN | MHQVEIVSKFKEVKVGNLFFSTCSNFSKSICVELGKVEGGS | 41 |
| 5800 | GC_00001099 | WO | WOPip5 | 61 | 3 | 3 | 1 | 0 | 1.000000 | 1.000000 | 1.000000 | NaN | NaN | NaN | NaN | MHQVEIVSKFKEVKVGNLFFSTCSNFSKSICVELGKVEGGS | 41 |
| 5813 | GC_00001104 | WO | PipJHB | 1297 | 3 | 3 | 1 | 0 | 1.000000 | 1.000000 | 1.000000 | NaN | NaN | NaN | NaN | MSQLKCNEKEKIHFVWFIILMVCVVITYCYQKSKATDNYNKTLQAA... | 172 |
| 5814 | GC_00001104 | WO | PipPel | 1350 | 3 | 3 | 1 | 0 | 1.000000 | 1.000000 | 1.000000 | NaN | NaN | NaN | NaN | MSQLKCNEKEKIHFVWFIILMVCVVITYCYQKSKATDNYNKTLQAA... | 172 |
| 5815 | GC_00001104 | WO | WOPip5 | 16 | 3 | 3 | 1 | 0 | 1.000000 | 1.000000 | 1.000000 | NaN | NaN | NaN | NaN | MSQLKCNEKEKIHFVWFIILMVCVVITYCYQKSKATDNYNKTLQAA... | 172 |
1639 rows × 17 columns
# Show the total number of rows in the filtered DataFrame
len(df_interest)
1639
Organizing Gene Clusters and Contigs based on Length
# Group by gene cluster ID and get the max length for each cluster
max_data = df_interest.drop(['gene_callers_id', 'aa_sequence'], axis=1).groupby('gene_cluster_id')['length'].max()
max_data
gene_cluster_id
GC_00000001    292
GC_00000002    412
GC_00000003    285
GC_00000007    226
GC_00000008    472
              ...
GC_00000991    119
GC_00001024    123
GC_00001077    464
GC_00001099     41
GC_00001104    172
Name: length, Length: 117, dtype: int64
GFF file generated by anvi’o / prodigal.
# Define a function to map gene caller IDs to contig names based on ranges
def get_contig_name(val): # based on the .gff file
    if val >= 0 and val <= 1175:
        return 'contig_2'
    if val >= 1176 and val <= 1196:
        return 'contig_23'
    if val >= 1197 and val <= 1300:
        return 'contig_3'
    if val >= 1301 and val <= 1311:
        return 'contig_24'
    if val >= 1312 and val <= 1337:
        return 'contig_10'
    if val >= 1338 and val <= 1368:
        return 'contig_9'
    if val >= 1369 and val <= 1372:
        return 'contig_15'
    if val >= 1373 and val <= 1382:
        return 'contig_13'
    if val >= 1383 and val <= 1396:
        return 'contig_7'
    if val >= 1397 and val <= 1441:
        return 'contig_22'
    if val >= 1442 and val <= 1471:
        return 'contig_14'
    if val >= 1472 and val <= 1473:
        return 'contig_5'
    if val >= 1474 and val <= 1476:
        return 'contig_19'
    if val >= 1477 and val <= 1484:
        return 'contig_38'
    if val >= 1485 and val <= 1488:
        return 'contig_6'
    if val >= 1489 and val <= 1492:
        return 'contig_17'
    if val >= 1493 and val <= 1495:
        return 'contig_1'
    if val >= 1496 and val <= 1496:
        return 'contig_20'
    if val >= 1497 and val <= 1498:
        return 'contig_27'
    if val >= 1499 and val <= 1499:
        return 'contig_8'
    if val >= 1500 and val <= 1501:
        return 'contig_18'
    if val >= 1502 and val <= 1502:
        return 'contig_26'
    if val >= 1503 and val <= 1504:
        return 'contig_16'
    if val >= 1505 and val <= 1507:
        return 'contig_21'
    raise ValueError
# Build a new DataFrame with information about each gene cluster, including contig names
new_df = []
for k, _ in max_data.items():
    dataframe = df_interest.loc[df_interest['genome_name'] == 'CelG3'].loc[df_interest['gene_cluster_id']==k]
    call_ids = dataframe['gene_callers_id'].tolist()
    x = dataframe['length'].max()
    contigs = []
    if call_ids:
        contigs = list(map(get_contig_name, call_ids))
        v = df_interest.loc[df_interest['genome_name'] == 'CelG3'].loc[df_interest['gene_cluster_id']==k].loc[df_interest['length']==x]
        assert (not v.empty)
        dc = v.iloc[0].to_dict()
    else:
        continue
    dc['all_call_ids'] = call_ids
    dc['contigs'] = list(set(contigs))
    new_df.append(dc)
new_df = pandas.DataFrame(new_df)
#df_interest.loc[df_interest['length'] == max_data]
# Count the number of unique gene cluster IDs in the new_df DataFrame.
# This gives the total number of distinct gene clusters found in CelG3.
len(new_df['gene_cluster_id'].unique())
114
2. Extracting, Selecting and Exporting Longest WO Sequences of CelG
# Import SeqIO from Biopython for parsing FASTA files.
from Bio import SeqIO

# Define a function to extract sequences from a FASTA file for a given contig ID.
def extract_sequences(fasta_file, contig_id):
    sequences = []
    # Parse the FASTA file
    for record in SeqIO.parse(fasta_file, "fasta"):
        # Check if the current record matches the desired contig ID
        if contig_id in record.id:
            # Extract the sequence from start to end position
            sequence = record.seq
            sequences.append(tuple((record.id, sequence)))
    return sequences
# Create a copy of new_df for further manipulation or backup.
new_df_copy = new_df.copy()
# Display the new_df DataFrame to inspect its contents.
new_df
| gene_cluster_id | bin_name | genome_name | gene_callers_id | num_genomes_gene_cluster_has_hits | num_genes_in_gene_cluster | max_num_paralogs | SCG | functional_homogeneity_index | geometric_homogeneity_index | combined_homogeneity_index | COG20_FUNCTION_ACC | COG20_FUNCTION | COG20_CATEGORY_ACC | COG20_CATEGORY | aa_sequence | length | all_call_ids | contigs | |
|---|---|---|---|---|---|---|---|---|---|---|---|---|---|---|---|---|---|---|---|
| 0 | GC_00000001 | WO | CelG3 | 580 | 7 | 163 | 54 | 0 | 0.993841 | 0.909133 | 0.949602 | COG3293 | Transposase | X | Mobilome: prophages, transposons | MKKDITELYCCVEDFCRAVDDNFANRFLSNGKKPTRVPEIAHSEIL... | 292 | [30, 60, 79, 98, 146, 219, 294, 410, 449, 476,... | [contig_22, contig_3, contig_2] |
| 1 | GC_00000002 | WO | CelG3 | 1323 | 6 | 140 | 52 | 0 | 0.690540 | 0.642119 | 0.665450 | COG3328 | Transposase (or an inactivated derivative) (IS... | X | Mobilome: prophages, transposons | ----------MSQKVVNRTTGLVDYKELETNILSSIREGRPLTGRD... | 410 | [10, 370, 446, 770, 809, 831, 921, 973, 994, 1... | [contig_1, contig_3, contig_2, contig_10] |
| 2 | GC_00000003 | WO | CelG3 | 1403 | 5 | 55 | 22 | 0 | 0.649601 | 0.657901 | 0.653725 | COG3335|COG3415 | Transposase|CRISPR-associated protein Csa3, CA... | X|V | Mobilome: prophages, transposons|Defense mecha... | ---------------------------MPAAYSYDLRKKAMEVLEE... | 285 | [1104, 1403, 959, 1373, 136, 137, 924, 478, 96... | [contig_22, contig_13, contig_2] |
| 3 | GC_00000007 | WO | CelG3 | 1259 | 6 | 34 | 10 | 0 | 0.901121 | 0.667771 | 0.767092 | COG3316 | Transposase (or an inactivated derivative), DD... | X | Mobilome: prophages, transposons | MFRISSKLLPYFKGFSFSAEIIMLSVYMKCRFSLSYRDLEEMLSIR... | 226 | [1145, 1166, 1273, 1322, 1143, 1235, 1259, 110... | [contig_3, contig_2, contig_10] |
| 4 | GC_00000008 | WO | CelG3 | 1183 | 8 | 30 | 8 | 0 | 0.950803 | 0.697140 | 0.804449 | COG5511 | Phage capsid protein | X | Mobilome: prophages, transposons | MLLKTFKQLFNKPKIKSSAWDTAGSGRRFFHFQPELGSINNLLSQS... | 472 | [1183, 1460, 1476, 1418, 1507, 1264, 1157, 1262] | [contig_22, contig_23, contig_19, contig_14, c... |
| ... | ... | ... | ... | ... | ... | ... | ... | ... | ... | ... | ... | ... | ... | ... | ... | ... | ... | ... | ... |
| 109 | GC_00000680 | WO | CelG3 | 1290 | 4 | 4 | 1 | 0 | 1.000000 | 1.000000 | 1.000000 | NaN | NaN | NaN | NaN | MVHSSAQIFTKFDNDSKQRNIEGLEKTYLGVLLSIELNSKTSQIAK... | 788 | [1290] | [contig_3] |
| 110 | GC_00000863 | WO | CelG3 | 1292 | 4 | 4 | 1 | 0 | 1.000000 | 1.000000 | 1.000000 | NaN | NaN | NaN | NaN | MFSFVTIAFSCAAISKNNTIAEKKDQLNQQSNEIASLKKQLDEKEI... | 181 | [1292] | [contig_3] |
| 111 | GC_00001024 | WO | CelG3 | 1409 | 4 | 4 | 1 | 0 | 0.997917 | 0.740670 | 0.850262 | NaN | NaN | NaN | NaN | -------------------------------------------MVY... | 80 | [1409] | [contig_22] |
| 112 | GC_00001077 | WO | CelG3 | 1370 | 4 | 4 | 1 | 0 | 0.991484 | 0.984407 | 0.987933 | COG4467 | Regulator of replication initiation timing Yab... | L | Replication, recombination and repair | -MISIVELCKNLEQKVAKLEEKNKILEIENAELRERLGLNSRNSSL... | 450 | [1370] | [contig_15] |
| 113 | GC_00001099 | WO | CelG3 | 1433 | 3 | 3 | 1 | 0 | 1.000000 | 1.000000 | 1.000000 | NaN | NaN | NaN | NaN | MHQVEIVSKFKEVKVGNLFFSTCSNFSKSICVELGKVEGGS | 41 | [1433] | [contig_22] |
114 rows × 19 columns
# Define a function to select the longest sequence from a list of sequences.
def select_longest(seqs):
    length = 0
    longest_seq = str(seqs[0][0]).replace('-', '')
    longest_name = seqs[0][1]
    longest_woseqid = seqs[0][2]
    for seq, name, woseqid in seqs:
        seqedit = str(seq).replace('-', '')
        thislength = len(seqedit)
        if thislength > length:
            length = thislength
            longest_seq = seqedit
            longest_name = name
            longest_woseqid = woseqid
            #print(thislength, longest_seq, longest_name)
    return longest_seq, longest_name, longest_woseqid
# Build a dictionary of extracted sequences for each gene cluster.
eseqs = {}
for i, row in new_df.iterrows():
    gc = row['gene_cluster_id']
    gene_callers_id = row['gene_callers_id']
    gc_new = ''
    # Extract sequences from the alignment file for the current gene cluster.
    seq = extract_sequences('./GENE-CLUSTER-ALIGNMENTS.fa', gc)
    tmpseqs = []
    mol = 0
    pel = 0
    jhb = 0
    wo = 0
    celg = 0
    celg_id = -1
    tmpseqs = []
    woseqs = []
    # Categorize sequences by genome type and collect relevant info.
    for x in seq:
        if 'CelG3' in x[0]:
            celg += 1
            tmpseqs.append((x[1], x[0].split('|')[2].split(':')[1], x[0].split('|')[3].split(':')[1]))
        elif 'PipPel' in x[0]:
            pel += 1
        elif 'PipJHB' in x[0]:
            jhb += 1
        elif 'PipMol' in x[0]:
            mol += 1
        elif 'WOPip' in x[0]:
            wo += 1
            woseqs.append((x[1], x[0].split('|')[2].split(':')[1], x[0].split('|')[3].split(':')[1]))
    # Select the longest WO and CelG sequences.
    _, woname, woseq_id = select_longest(woseqs)
    lgseq, lgname, celg_id = select_longest(tmpseqs)
    # Build a summary string for the gene cluster.
    woseq = ''.join(sorted([x.replace('WOPip', '') for x in df.loc[df['gene_cluster_id'] == gc]['genome_name'].unique() if 'WOPip' in x]))
    gc_new = gc + '|genome_name:' + str(lgname) + '|' + 'WO:' + str(wo) + '|' + 'Pel:' + str(pel) + '|JHB:' + str(jhb) + '|Mol:' + str(mol) + '|CelG:' + str(celg) + '|Pip:' + str(woseq) + '|celg_id:' + str(celg_id) + '|woseq_id:' + str(woseq_id) + '|woname:' + str(woname) +  '|len:' + str(len(lgseq))
    # Store the cleaned sequence (the longest gene cluster sequence in CelG) in the dictionary.
    if gc_new:
        eseqs[gc_new] = str(lgseq).replace('-', '')
# Display the dictionary of extracted sequences for each gene cluster.
dict(list(eseqs.items())[:4])
{'GC_00000001|genome_name:CelG3|WO:7|Pel:51|JHB:54|Mol:0|CelG:51|Pip:1345|celg_id:580|woseq_id:0|woname:WOPip1|len:879': 'ATGAAGAAAGATATTACAGAACTGTACTGTTGCGTCGAGGATTTTTGTCGTGCGGTAGATGATAATTTTGCAAATAGGTTCTTATCAAACGGCAAAAAACCAACCAGAGTACCAGAAATAGCGCACTCAGAAATTCTAACCATAATCCTGTTATACCATAAATCACCATGTAAAAACTTCAAGGCTTTTTATCTTTGTTATCTTCAGTTATTCTATAGATCAGAGTTTTCAAAGCTGCCTTCATATCACAGATTTATTGCCTTAAAGCCGCGAGTTTTGTGGTATTTAGCATTACTTTTGCAATGGTTCTGTGAACAAGCGAAAATGACCGGCACTTCCTACATCGACACCTCTACGATTGCCGTTTGCCACAAAAAAAGGATCTCTAGGAATAAAGTTTTTAATCATCTAGCAGAAATTAGTAAGAGTACGTATGGTTGGTTTTTTGGCTTCAAGTTGCACTTAGTGATTAACGAAATTGGTGAAATTCAAGCACTTACCCTAACCAAAGGTAACGTTGATGACAGAAAACCTTTACCAACTCTCACTAAAAGACTGACCGGACTTTTGTTTGGAGATAAGGGCTATATAAAGAAAGAGCTTTTTGAGAAACTCTTCGATAGAGGCCTAAAGTTAGTCACTAAAGTAAAAAAAGGTATGAAAAACGCACTAATTTCACTTAAAGAGAAGATTTTATTAAGGAAAAGGTCGATTATTGAGACTGTTTTTGATTCCTTGAAAAACAAATTTGAGATTGAGCATACAAGACATAGATCGCCAACAAATTTCCTAATTCATGTTTTTTCTGTTCTGATTTCCTACTCCATGCAGTCCAAAAGCCTTCTATTTCTATGCCTTTCTTTATCGGCTAATCCATAA',
 'GC_00000002|genome_name:CelG3|WO:4|Pel:40|JHB:35|Mol:9|CelG:52|Pip:13|celg_id:1323|woseq_id:53|woname:WOPip1|len:1233': 'ATGAGTCAGAAAGTAGTAAACAGAACTACCGGTTTGGTAGATTATAAAGAATTAGAAACAAATATCCTGTCGTCTATACGAGAAGGAAGACCGTTGACAGGAAGAGATGGAGCATTAACACCGTTTATAAAAAAGTTGCTGGAGGTAAGCCTGGAAGGTGAAATAGAAAACCACTTGTCGGCCGAAAGCGAAGAGAATAATCGAAGAAATGGGAGGAATGCAAAGACTTTACGTACAAGCGCAGGGNNNTTTGAGCTTTTGACGCCAAGAGATAGGGAAGGAAGTTTCGAACCACAAATAGTCAAAAAAAGGCAAACAAACTTACATCCAGAGCTTGAAACGAAGATTTTGAGCACATTTGCCAGTGGTATGGGCTATAGAGATATAGTGTCACATGTTGAGGAAATTTATGATCACAAAATATCGGCGGCAGAGATATCAAGTATTACTGACAAATTGCTACCAGTAATCAACGAATGGCGTAGTCGCCCGCTGCAGTCTGTATATCCGATAGTTTTCATGGATGGCATGTTTTTTAAAGTCAAAGAGGACGGGCATTGCGTAAGTAAATGCATGTATAACATATTAGGCATAGATCAAAATGGCAAAAAAGAAGTATTAGGTTTTTATTTGGCTGAAAGTGNNAAGTTCTGGTTGGGAGTGCTAAATGACCTCAAAGAAAGAGGAGTAGAAGATATCCTTATTGCCTGCGTTGATGGGCTGAAAAGCTTTCCTGCAGCTATAAACAGTGTCTTTCCTAATGCGGAAGTGCAGATGTGTATAGTGCATCAGATACGCAACTCACTGAAGTATGTGGCCAGTAAAGATGCGAAGAGTTTTTTGAGCGATTTAAAGAAGGTATATCAAGCTTCAAGCAAGGAAATTGCCGAGAATTATCTGTTGGAATTGGATGAAAAATGGGGCACAAAGTACCCTATGGTTATAAAATCTTGGCAGAATAATTGGGAAAACTTGTCTGGTTATTTTAAGTATTCTGGTCCAGTTAGGAGGATAATCTACACCACCAATCCCATAGAGGGGCTACATAGGCAAATTAGGAAATTCACTAAGACCAAAGGCTCATTTACCAGCATAAATGCCTTGTATAAGCAGGTATATTGTGCTATAAAGAAGGTAGAGGAAAAGTCGACGATGCCTGTACATGATTGGGCATTAACTATCTCTCAACTTGATGTTTTCTTTCCTGGCAGATTGAAAATTGAGTTGAACTAA',
 'GC_00000003|genome_name:CelG3|WO:2|Pel:13|JHB:22|Mol:5|CelG:13|Pip:1|celg_id:1403|woseq_id:33|woname:WOPip1|len:858': 'ATGCCAGCAGCATATAGTTATGATTTAAGAAAAAAAGCAATGGAAGTACTAGAAGAAGGGGAAAGGAGAGAAACAGTGGCAGCAAGATTTAAAATTGGAAAAACTACATTATGGGAGTGGCAGCAAAGAAAAAAAGAAACAGGAGATTTTCAGTCAAAAAAACTTGGAAATGTAGGTTATAATCACAAAATTACCGACAGGAATAAATTTACTGAATTTGCCAAAAAACATGGTGGAAAAACTCTATCGGAAATGGCTAAGCTTTGGGGCAATGTTAGTATCACAACGATCCATCGAGCTCTTAAAAAAATTGGACTCACACAAAAAAAGACATATGGATACAAAGAAAGGAACGAAGAAAAACGCGCTGAATTTTTGAAAATTATAGCAACAAAAGAACCTCAAAACTTAGTATATATAGATGAGTCTGGCATTGATAACACTGAGGACTACCCTTATGGATATTGCCAGAAGGGACAGCGCTTTTATGCTCTAAAATCTGGTAAAAAAATTCAACGAATCAGTATGATTGCAGCCTTAAACGGCAGAAAAATAGCTGTTCCGTTAACATTTGAAGGCCACTGTAATATGGATATCTTTAATAAATGGTTTGAGCAGTTCCTGACACCGATTTTGGAACCTGGACAAACTGTTATCCTTGATAATGCTACTTTTCATAAGTCTAATAAGATTACTGAACTTGCTAAAGGAGTTGGTGCAGAAATTTTATATCTACCGCCTTATTCTCCCGATTTTAACAAAATTGAGCATCATTGGTTTGCTATAAAAAACAGAGCTAGGAAAAACATCCCTCTATTCACATCTTTTCGTCATGCTGTTGATTCTGCTTTTCTATAA',
 'GC_00000007|genome_name:CelG3|WO:4|Pel:8|JHB:10|Mol:3|CelG:9|Pip:15|celg_id:1259|woseq_id:1|woname:WOPip5|len:681': 'ATGTTTCGTATTAGTTCAAAATTATTGCCATATTTCAAAGGATTTAGCTTTTCAGCAGAGATAATAATGTTATCTGTATATATGAAATGTAGATTCTCTTTGAGCTATCGAGATTTGGAAGAAATGCTGAGTATAAGGGGAGCAAAATGCTACGTTACAAAGGTGGGTTANTCACCACTGATAGATGAAGCGGTAAGGAAAAGGAAGAAGCAGGTTGGCAGTAGCTGGANNGAGACCTACGTTAAATTAAACGGCAAATGGGTTTATCTATACAGAGCACTNATTGGTAATACTGTAGACTTTCTGTTGTGTGCTCGTAGAGACAAGTCTGCGGCACTTGCGTTCTTTCGTAAAGCCTTTAGAGAGAATAACCTTCCTGAGAAAGTAGTAATTGATAAAAGCGGCAGTAATACTGCTGCTCTTGATGATTTGAATACAGAAATTTCTGAAGATTGTAGAATCATGGTTTTTCAAATAAAATATCTAAATAATATTGTCGAACAAGATCATAGATTTATCAAAAAACGAATAAAGCCAATGCTTGGTTTTAAGAGCTTCCACTCCGCNAAAGATACCATTACCGGCATAGAAAATATTCGTATGATTCAAAAAAGACAAATTATCGGGGCTAATGATAATGTTTCTACTTTTGAGAATTTTGCTATGCTAATTGCTCTATAA'}
# Import Biopython modules for writing FASTA files.
from Bio import SeqIO
from Bio.Seq import Seq
from Bio.SeqRecord import SeqRecord

# Define output FASTA file name.
output_file = 'CelG3_gene_clusters_wo.fasta'
# Write each sequence in eseqs to the FASTA file.
with open(output_file, "w") as output_handle:
    for seq, sq in eseqs.items():
        new_record = SeqRecord(sq, id=seq, description='')
        SeqIO.write(new_record, output_handle, "fasta")
/home/maxime/anaconda3/lib/python3.9/site-packages/Bio/SeqRecord.py:229: BiopythonDeprecationWarning: Using a string as the sequence is deprecated and will raise a TypeError in future. It has been converted to a Seq object.
  warnings.warn(
“CelG3_gene_clusters_wo.fasta”
3. Mapping Reads to Sequences and Calculating Coverage
Run minimap2 to align CelG3 gene cluster sequences (FASTA) against the Cel_g3_SUP.target reads (FASTQ). The output is a SAM file containing the alignments.
!minimap2 -ax map-ont CelG3_gene_clusters_wo.fasta ../Reads_Alice/Cel_g3_SUP.target.fastq.gz > CelG3_gene_clusters_align.sam
Convert the SAM file to BAM format, filtering out alignments with mapping quality less than 2.
!samtools view -bq 2 CelG3_gene_clusters_align.sam > CelG3_gene_clusters_align_filtered.bam
Sort the filtered BAM file by coordinate for downstream analysis.
!samtools sort CelG3_gene_clusters_align_filtered.bam > CelG3_gene_clusters_align_filtered_sorted.bam
Index the sorted BAM file to allow rapid access for coverage and visualization tools.
!samtools index CelG3_gene_clusters_align_filtered_sorted.bam# Calculate per-base coverage for each gene cluster using the sorted BAM file.
The output is a text file with coverage information for each position.
!bedtools genomecov -ibam CelG3_gene_clusters_align_filtered_sorted.bam -d > Coverage_CelG3_WO_GC.txt
Coverage Data Processing
# Read the coverage file into a pandas DataFrame for further analysis.
bed = pandas.read_csv('Coverage_CelG3_WO_GC.txt', sep='\t', header=None)
bed
| 0 | 1 | 2 | |
|---|---|---|---|
| 0 | GC_00000001|genome_name:CelG3|WO:7|Pel:51|JHB:... | 1 | 1377 |
| 1 | GC_00000001|genome_name:CelG3|WO:7|Pel:51|JHB:... | 2 | 1414 |
| 2 | GC_00000001|genome_name:CelG3|WO:7|Pel:51|JHB:... | 3 | 1462 |
| 3 | GC_00000001|genome_name:CelG3|WO:7|Pel:51|JHB:... | 4 | 1472 |
| 4 | GC_00000001|genome_name:CelG3|WO:7|Pel:51|JHB:... | 5 | 1491 |
| ... | ... | ... | ... |
| 136465 | GC_00001099|genome_name:CelG3|WO:1|Pel:1|JHB:0... | 122 | 63 |
| 136466 | GC_00001099|genome_name:CelG3|WO:1|Pel:1|JHB:0... | 123 | 61 |
| 136467 | GC_00001099|genome_name:CelG3|WO:1|Pel:1|JHB:0... | 124 | 61 |
| 136468 | GC_00001099|genome_name:CelG3|WO:1|Pel:1|JHB:0... | 125 | 61 |
| 136469 | GC_00001099|genome_name:CelG3|WO:1|Pel:1|JHB:0... | 126 | 60 |
136470 rows × 3 columns
# Make a copy of the coverage DataFrame and clean the first column to keep only the gene cluster ID.
dfcov = bed.copy()
dfcov[0] = dfcov[0].str.split('|', expand=True)[0]
# Save the cleaned coverage DataFrame to a new text file, keeping only gene cluster IDs.
dfcov.to_csv('Coverage_CelG3_WO_GC_gc_only.txt', sep='\t', header=None, index=None)
# Group the coverage DataFrame by gene cluster ID and calculate the mean coverage for each cluster.
df2 = bed.groupby(0)[2].mean().reset_index()
# Split the gene cluster info in the first column into separate columns for easier analysis.
col = df2[0].str.split('|', expand=True)
# Concatenate the split columns with the mean coverage values into a new DataFrame.
df2 = pandas.concat([col, df2.drop(0, axis=1).rename({2: 'value'}, axis=1)], axis=1)
# Sort the DataFrame by coverage value in descending order.
df2 = df2.sort_values('value', ascending=False)
# Display the sorted DataFrame to inspect coverage values for each gene cluster.
df2
| 0 | 1 | 2 | 3 | 4 | 5 | 6 | 7 | 8 | 9 | 10 | 11 | value | |
|---|---|---|---|---|---|---|---|---|---|---|---|---|---|
| 0 | GC_00000001 | genome_name:CelG3 | WO:7 | Pel:51 | JHB:54 | Mol:0 | CelG:51 | Pip:1345 | celg_id:580 | woseq_id:0 | woname:WOPip1 | len:879 | 1698.784983 |
| 1 | GC_00000002 | genome_name:CelG3 | WO:4 | Pel:40 | JHB:35 | Mol:9 | CelG:52 | Pip:13 | celg_id:1323 | woseq_id:53 | woname:WOPip1 | len:1233 | 596.924574 |
| 15 | GC_00000019 | genome_name:CelG3 | WO:2 | Pel:3 | JHB:9 | Mol:1 | CelG:6 | Pip:45 | celg_id:784 | woseq_id:34 | woname:WOPip4 | len:948 | 329.422996 |
| 3 | GC_00000007 | genome_name:CelG3 | WO:4 | Pel:8 | JHB:10 | Mol:3 | CelG:9 | Pip:15 | celg_id:1259 | woseq_id:1 | woname:WOPip5 | len:681 | 301.992658 |
| 23 | GC_00000027 | genome_name:CelG3 | WO:4 | Pel:4 | JHB:3 | Mol:3 | CelG:4 | Pip:1245 | celg_id:1178 | woseq_id:21 | woname:WOPip1 | len:1233 | 283.450933 |
| ... | ... | ... | ... | ... | ... | ... | ... | ... | ... | ... | ... | ... | ... |
| 75 | GC_00000098 | genome_name:CelG3 | WO:1 | Pel:1 | JHB:1 | Mol:1 | CelG:2 | Pip:2 | celg_id:1332 | woseq_id:28 | woname:WOPip2 | len:1914 | 28.958725 |
| 77 | GC_00000111 | genome_name:CelG3 | WO:1 | Pel:1 | JHB:1 | Mol:1 | CelG:1 | Pip:3 | celg_id:1498 | woseq_id:15 | woname:WOPip3 | len:1302 | 24.525346 |
| 78 | GC_00000112 | genome_name:CelG3 | WO:1 | Pel:1 | JHB:1 | Mol:1 | CelG:1 | Pip:1 | celg_id:1320 | woseq_id:48 | woname:WOPip1 | len:519 | 22.990366 |
| 104 | GC_00000192 | genome_name:CelG3 | WO:1 | Pel:1 | JHB:1 | Mol:0 | CelG:1 | Pip:3 | celg_id:1299 | woseq_id:17 | woname:WOPip3 | len:264 | 22.757576 |
| 86 | GC_00000120 | genome_name:CelG3 | WO:1 | Pel:1 | JHB:1 | Mol:1 | CelG:1 | Pip:1 | celg_id:1321 | woseq_id:49 | woname:WOPip1 | len:411 | 21.776156 |
114 rows × 13 columns
4. Regression Analysis: Coverage vs. Copy Number
To estimate the number of gene cluster copies in CelG based on sequencing coverage, we fit a linear regression model. This allows us to predict copy number for any observed coverage value.
Prepare Data for Regression
# Make a copy of the coverage DataFrame for regression analysis.
df3 = df2.copy()
# Clean up columns for regression
# Extract numeric values from columns 2, 3, and 6 for regression.
df3[2] = df3[2].apply(lambda x: int(x[x.index(':')+1:]))
df3[3] = df3[3].apply(lambda x: int(x[x.index(':')+1:]))
df3[6] = df3[6].apply(lambda x: int(x[x.index(':')+1:]))
# Show the cleaned DataFrame with numeric columns ready for regression.
df3
| 0 | 1 | 2 | 3 | 4 | 5 | 6 | 7 | 8 | 9 | 10 | 11 | value | |
|---|---|---|---|---|---|---|---|---|---|---|---|---|---|
| 0 | GC_00000001 | genome_name:CelG3 | 7 | 51 | JHB:54 | Mol:0 | 51 | Pip:1345 | celg_id:580 | woseq_id:0 | woname:WOPip1 | len:879 | 1698.784983 |
| 1 | GC_00000002 | genome_name:CelG3 | 4 | 40 | JHB:35 | Mol:9 | 52 | Pip:13 | celg_id:1323 | woseq_id:53 | woname:WOPip1 | len:1233 | 596.924574 |
| 15 | GC_00000019 | genome_name:CelG3 | 2 | 3 | JHB:9 | Mol:1 | 6 | Pip:45 | celg_id:784 | woseq_id:34 | woname:WOPip4 | len:948 | 329.422996 |
| 3 | GC_00000007 | genome_name:CelG3 | 4 | 8 | JHB:10 | Mol:3 | 9 | Pip:15 | celg_id:1259 | woseq_id:1 | woname:WOPip5 | len:681 | 301.992658 |
| 23 | GC_00000027 | genome_name:CelG3 | 4 | 4 | JHB:3 | Mol:3 | 4 | Pip:1245 | celg_id:1178 | woseq_id:21 | woname:WOPip1 | len:1233 | 283.450933 |
| ... | ... | ... | ... | ... | ... | ... | ... | ... | ... | ... | ... | ... | ... |
| 75 | GC_00000098 | genome_name:CelG3 | 1 | 1 | JHB:1 | Mol:1 | 2 | Pip:2 | celg_id:1332 | woseq_id:28 | woname:WOPip2 | len:1914 | 28.958725 |
| 77 | GC_00000111 | genome_name:CelG3 | 1 | 1 | JHB:1 | Mol:1 | 1 | Pip:3 | celg_id:1498 | woseq_id:15 | woname:WOPip3 | len:1302 | 24.525346 |
| 78 | GC_00000112 | genome_name:CelG3 | 1 | 1 | JHB:1 | Mol:1 | 1 | Pip:1 | celg_id:1320 | woseq_id:48 | woname:WOPip1 | len:519 | 22.990366 |
| 104 | GC_00000192 | genome_name:CelG3 | 1 | 1 | JHB:1 | Mol:0 | 1 | Pip:3 | celg_id:1299 | woseq_id:17 | woname:WOPip3 | len:264 | 22.757576 |
| 86 | GC_00000120 | genome_name:CelG3 | 1 | 1 | JHB:1 | Mol:1 | 1 | Pip:1 | celg_id:1321 | woseq_id:49 | woname:WOPip1 | len:411 | 21.776156 |
114 rows × 13 columns
# Display gene clusters with coverage value greater than 120 (suggesting 4 copies).
df3.loc[df3['value']> 120] # 4 copies
| 0 | 1 | 2 | 3 | 4 | 5 | 6 | 7 | 8 | 9 | 10 | 11 | value | |
|---|---|---|---|---|---|---|---|---|---|---|---|---|---|
| 0 | GC_00000001 | genome_name:CelG3 | 7 | 51 | JHB:54 | Mol:0 | 51 | Pip:1345 | celg_id:580 | woseq_id:0 | woname:WOPip1 | len:879 | 1698.784983 |
| 1 | GC_00000002 | genome_name:CelG3 | 4 | 40 | JHB:35 | Mol:9 | 52 | Pip:13 | celg_id:1323 | woseq_id:53 | woname:WOPip1 | len:1233 | 596.924574 |
| 15 | GC_00000019 | genome_name:CelG3 | 2 | 3 | JHB:9 | Mol:1 | 6 | Pip:45 | celg_id:784 | woseq_id:34 | woname:WOPip4 | len:948 | 329.422996 |
| 3 | GC_00000007 | genome_name:CelG3 | 4 | 8 | JHB:10 | Mol:3 | 9 | Pip:15 | celg_id:1259 | woseq_id:1 | woname:WOPip5 | len:681 | 301.992658 |
| 23 | GC_00000027 | genome_name:CelG3 | 4 | 4 | JHB:3 | Mol:3 | 4 | Pip:1245 | celg_id:1178 | woseq_id:21 | woname:WOPip1 | len:1233 | 283.450933 |
| 2 | GC_00000003 | genome_name:CelG3 | 2 | 13 | JHB:22 | Mol:5 | 13 | Pip:1 | celg_id:1403 | woseq_id:33 | woname:WOPip1 | len:858 | 282.954545 |
| 31 | GC_00000035 | genome_name:CelG3 | 4 | 4 | JHB:5 | Mol:0 | 4 | Pip:1245 | celg_id:1177 | woseq_id:22 | woname:WOPip1 | len:465 | 274.580645 |
| 16 | GC_00000020 | genome_name:CelG3 | 5 | 5 | JHB:5 | Mol:2 | 4 | Pip:12345 | celg_id:1188 | woseq_id:11 | woname:WOPip1 | len:426 | 269.363850 |
| 18 | GC_00000022 | genome_name:CelG3 | 4 | 5 | JHB:4 | Mol:2 | 5 | Pip:1235 | celg_id:1182 | woseq_id:17 | woname:WOPip1 | len:225 | 253.160000 |
| 19 | GC_00000023 | genome_name:CelG3 | 5 | 5 | JHB:4 | Mol:2 | 4 | Pip:12345 | celg_id:1186 | woseq_id:13 | woname:WOPip1 | len:1005 | 250.139303 |
| 12 | GC_00000016 | genome_name:CelG3 | 5 | 5 | JHB:4 | Mol:4 | 4 | Pip:12345 | celg_id:1190 | woseq_id:9 | woname:WOPip1 | len:465 | 245.081720 |
| 5 | GC_00000009 | genome_name:CelG3 | 5 | 6 | JHB:6 | Mol:4 | 7 | Pip:12345 | celg_id:1211 | woseq_id:20 | woname:WOPip4 | len:1062 | 243.768362 |
| 11 | GC_00000015 | genome_name:CelG3 | 5 | 5 | JHB:3 | Mol:4 | 6 | Pip:12345 | celg_id:1185 | woseq_id:14 | woname:WOPip1 | len:372 | 230.545699 |
| 13 | GC_00000017 | genome_name:CelG3 | 5 | 5 | JHB:4 | Mol:4 | 4 | Pip:12345 | celg_id:1191 | woseq_id:8 | woname:WOPip1 | len:255 | 221.152941 |
| 30 | GC_00000034 | genome_name:CelG3 | 4 | 4 | JHB:3 | Mol:2 | 4 | Pip:1345 | celg_id:1187 | woseq_id:12 | woname:WOPip1 | len:306 | 218.790850 |
| 7 | GC_00000011 | genome_name:CelG3 | 4 | 6 | JHB:7 | Mol:3 | 6 | Pip:1235 | celg_id:1181 | woseq_id:18 | woname:WOPip1 | len:1836 | 216.826797 |
| 24 | GC_00000028 | genome_name:CelG3 | 4 | 4 | JHB:4 | Mol:3 | 3 | Pip:1234 | celg_id:1470 | woseq_id:6 | woname:WOPip1 | len:792 | 213.707071 |
| 26 | GC_00000030 | genome_name:CelG3 | 3 | 3 | JHB:6 | Mol:3 | 3 | Pip:145 | celg_id:1200 | woseq_id:31 | woname:WOPip4 | len:504 | 207.505952 |
| 6 | GC_00000010 | genome_name:CelG3 | 5 | 5 | JHB:7 | Mol:5 | 6 | Pip:1245 | celg_id:1317 | woseq_id:45 | woname:WOPip1 | len:1026 | 204.800195 |
| 28 | GC_00000032 | genome_name:CelG3 | 3 | 3 | JHB:5 | Mol:4 | 3 | Pip:145 | celg_id:1482 | woseq_id:50 | woname:WOPip4 | len:1005 | 204.353234 |
| 14 | GC_00000018 | genome_name:CelG3 | 5 | 5 | JHB:4 | Mol:4 | 4 | Pip:12345 | celg_id:1189 | woseq_id:10 | woname:WOPip1 | len:477 | 202.607966 |
| 39 | GC_00000043 | genome_name:CelG3 | 3 | 3 | JHB:2 | Mol:1 | 4 | Pip:125 | celg_id:1180 | woseq_id:19 | woname:WOPip1 | len:1473 | 198.256619 |
| 33 | GC_00000037 | genome_name:CelG3 | 3 | 3 | JHB:1 | Mol:3 | 5 | Pip:125 | celg_id:1492 | woseq_id:20 | woname:WOPip1 | len:492 | 197.861789 |
| 4 | GC_00000008 | genome_name:CelG3 | 4 | 7 | JHB:8 | Mol:3 | 8 | Pip:1235 | celg_id:1183 | woseq_id:16 | woname:WOPip1 | len:1419 | 195.592671 |
| 29 | GC_00000033 | genome_name:CelG3 | 4 | 4 | JHB:3 | Mol:3 | 3 | Pip:1234 | celg_id:1192 | woseq_id:7 | woname:WOPip1 | len:336 | 195.214286 |
| 53 | GC_00000058 | genome_name:CelG3 | 2 | 2 | JHB:4 | Mol:1 | 1 | Pip:45 | celg_id:1392 | woseq_id:37 | woname:WOPip4 | len:195 | 180.666667 |
| 59 | GC_00000064 | genome_name:CelG3 | 2 | 2 | JHB:3 | Mol:1 | 2 | Pip:1 | celg_id:1380 | woseq_id:40 | woname:WOPip1 | len:657 | 178.831050 |
| 46 | GC_00000051 | genome_name:CelG3 | 2 | 2 | JHB:4 | Mol:2 | 2 | Pip:45 | celg_id:1303 | woseq_id:17 | woname:WOPip5 | len:945 | 174.626455 |
| 52 | GC_00000057 | genome_name:CelG3 | 1 | 1 | JHB:5 | Mol:2 | 2 | Pip:1 | celg_id:1379 | woseq_id:39 | woname:WOPip1 | len:1194 | 174.362647 |
| 8 | GC_00000012 | genome_name:CelG3 | 6 | 6 | JHB:6 | Mol:3 | 4 | Pip:145 | celg_id:1494 | woseq_id:52 | woname:WOPip4 | len:1035 | 171.591304 |
| 22 | GC_00000026 | genome_name:CelG3 | 3 | 3 | JHB:6 | Mol:4 | 3 | Pip:145 | celg_id:1406 | woseq_id:30 | woname:WOPip1 | len:807 | 171.301115 |
| 61 | GC_00000068 | genome_name:CelG3 | 1 | 1 | JHB:3 | Mol:3 | 1 | Pip:1 | celg_id:1318 | woseq_id:46 | woname:WOPip1 | len:1548 | 169.771964 |
| 55 | GC_00000060 | genome_name:CelG3 | 2 | 2 | JHB:4 | Mol:1 | 1 | Pip:45 | celg_id:1393 | woseq_id:36 | woname:WOPip4 | len:1218 | 166.293103 |
| 34 | GC_00000038 | genome_name:CelG3 | 2 | 2 | JHB:5 | Mol:2 | 4 | Pip:45 | celg_id:1199 | woseq_id:32 | woname:WOPip4 | len:684 | 161.137427 |
| 44 | GC_00000048 | genome_name:CelG3 | 2 | 2 | JHB:5 | Mol:2 | 1 | Pip:45 | celg_id:1391 | woseq_id:38 | woname:WOPip4 | len:1374 | 160.441776 |
| 10 | GC_00000014 | genome_name:CelG3 | 3 | 3 | JHB:9 | Mol:1 | 8 | Pip:45 | celg_id:1394 | woseq_id:30 | woname:WOPip5 | len:1272 | 155.520440 |
| 87 | GC_00000121 | genome_name:CelG3 | 1 | 1 | JHB:1 | Mol:1 | 1 | Pip:1 | celg_id:1378 | woseq_id:38 | woname:WOPip1 | len:915 | 154.902732 |
| 21 | GC_00000025 | genome_name:CelG3 | 3 | 4 | JHB:4 | Mol:5 | 4 | Pip:234 | celg_id:1226 | woseq_id:5 | woname:WOPip4 | len:1488 | 142.017473 |
| 54 | GC_00000059 | genome_name:CelG3 | 2 | 2 | JHB:4 | Mol:1 | 1 | Pip:45 | celg_id:1390 | woseq_id:39 | woname:WOPip4 | len:552 | 140.601449 |
| 49 | GC_00000054 | genome_name:CelG3 | 1 | 2 | JHB:4 | Mol:2 | 2 | Pip:1 | celg_id:1315 | woseq_id:43 | woname:WOPip1 | len:558 | 137.322581 |
| 43 | GC_00000047 | genome_name:CelG3 | 1 | 2 | JHB:5 | Mol:1 | 4 | Pip:1 | celg_id:621 | woseq_id:42 | woname:WOPip1 | len:1830 | 136.138251 |
| 9 | GC_00000013 | genome_name:CelG3 | 4 | 4 | JHB:5 | Mol:6 | 5 | Pip:1234 | celg_id:1194 | woseq_id:22 | woname:WOPip2 | len:1161 | 131.980189 |
| 101 | GC_00000180 | genome_name:CelG3 | 1 | 1 | JHB:1 | Mol:1 | 1 | Pip:1 | celg_id:1377 | woseq_id:37 | woname:WOPip1 | len:912 | 129.797149 |
| 35 | GC_00000039 | genome_name:CelG3 | 2 | 2 | JHB:5 | Mol:4 | 2 | Pip:15 | celg_id:1319 | woseq_id:47 | woname:WOPip1 | len:3534 | 128.822581 |
| 56 | GC_00000061 | genome_name:CelG3 | 2 | 2 | JHB:4 | Mol:1 | 1 | Pip:45 | celg_id:1389 | woseq_id:40 | woname:WOPip4 | len:1179 | 125.394402 |
| 38 | GC_00000042 | genome_name:CelG3 | 2 | 3 | JHB:5 | Mol:3 | 1 | Pip:14 | celg_id:1374 | woseq_id:48 | woname:WOPip4 | len:204 | 123.931373 |
| 57 | GC_00000062 | genome_name:CelG3 | 2 | 2 | JHB:4 | Mol:1 | 1 | Pip:45 | celg_id:1388 | woseq_id:41 | woname:WOPip4 | len:507 | 122.899408 |
| 68 | GC_00000091 | genome_name:CelG3 | 2 | 2 | JHB:0 | Mol:1 | 1 | Pip:12 | celg_id:1451 | woseq_id:28 | woname:WOPip1 | len:495 | 122.238384 |
| 41 | GC_00000045 | genome_name:CelG3 | 3 | 3 | JHB:3 | Mol:1 | 3 | Pip:234 | celg_id:1195 | woseq_id:16 | woname:WOPip3 | len:711 | 120.831224 |
| 60 | GC_00000065 | genome_name:CelG3 | 1 | 2 | JHB:2 | Mol:1 | 3 | Pip:1 | celg_id:541 | woseq_id:44 | woname:WOPip1 | len:1344 | 120.829613 |
# Show unique values in column 2 (e.g., number of copies).
df3[2].unique()
array([7, 4, 2, 5, 3, 1, 6])
# Sort the DataFrame by coverage value in ascending order and reset index.
df3 = df3.sort_values('value', ascending=True).reset_index(drop=True)
# Make another copy of the sorted DataFrame for further analysis.
df4 = df3.copy()
# Show the new DataFrame prepared for regression and plotting.
df4
| 0 | 1 | 2 | 3 | 4 | 5 | 6 | 7 | 8 | 9 | 10 | 11 | value | |
|---|---|---|---|---|---|---|---|---|---|---|---|---|---|
| 0 | GC_00000120 | genome_name:CelG3 | 1 | 1 | JHB:1 | Mol:1 | 1 | Pip:1 | celg_id:1321 | woseq_id:49 | woname:WOPip1 | len:411 | 21.776156 |
| 1 | GC_00000192 | genome_name:CelG3 | 1 | 1 | JHB:1 | Mol:0 | 1 | Pip:3 | celg_id:1299 | woseq_id:17 | woname:WOPip3 | len:264 | 22.757576 |
| 2 | GC_00000112 | genome_name:CelG3 | 1 | 1 | JHB:1 | Mol:1 | 1 | Pip:1 | celg_id:1320 | woseq_id:48 | woname:WOPip1 | len:519 | 22.990366 |
| 3 | GC_00000111 | genome_name:CelG3 | 1 | 1 | JHB:1 | Mol:1 | 1 | Pip:3 | celg_id:1498 | woseq_id:15 | woname:WOPip3 | len:1302 | 24.525346 |
| 4 | GC_00000098 | genome_name:CelG3 | 1 | 1 | JHB:1 | Mol:1 | 2 | Pip:2 | celg_id:1332 | woseq_id:28 | woname:WOPip2 | len:1914 | 28.958725 |
| ... | ... | ... | ... | ... | ... | ... | ... | ... | ... | ... | ... | ... | ... |
| 109 | GC_00000027 | genome_name:CelG3 | 4 | 4 | JHB:3 | Mol:3 | 4 | Pip:1245 | celg_id:1178 | woseq_id:21 | woname:WOPip1 | len:1233 | 283.450933 |
| 110 | GC_00000007 | genome_name:CelG3 | 4 | 8 | JHB:10 | Mol:3 | 9 | Pip:15 | celg_id:1259 | woseq_id:1 | woname:WOPip5 | len:681 | 301.992658 |
| 111 | GC_00000019 | genome_name:CelG3 | 2 | 3 | JHB:9 | Mol:1 | 6 | Pip:45 | celg_id:784 | woseq_id:34 | woname:WOPip4 | len:948 | 329.422996 |
| 112 | GC_00000002 | genome_name:CelG3 | 4 | 40 | JHB:35 | Mol:9 | 52 | Pip:13 | celg_id:1323 | woseq_id:53 | woname:WOPip1 | len:1233 | 596.924574 |
| 113 | GC_00000001 | genome_name:CelG3 | 7 | 51 | JHB:54 | Mol:0 | 51 | Pip:1345 | celg_id:580 | woseq_id:0 | woname:WOPip1 | len:879 | 1698.784983 |
114 rows × 13 columns
Regression Model and Copy Number Predictions
# Import natsort for natural sorting of gene cluster IDs.
from natsort import natsorted
# Import seaborn and matplotlib for plotting.
import seaborn as sns
import matplotlib.pyplot as plt
# Import numpy for numerical operations.
import numpy
# Show the DataFrame for inspection before regression.
df4
| 0 | 1 | 2 | 3 | 4 | 5 | 6 | 7 | 8 | 9 | 10 | 11 | value | |
|---|---|---|---|---|---|---|---|---|---|---|---|---|---|
| 0 | GC_00000120 | genome_name:CelG3 | 1 | 1 | JHB:1 | Mol:1 | 1 | Pip:1 | celg_id:1321 | woseq_id:49 | woname:WOPip1 | len:411 | 21.776156 |
| 1 | GC_00000192 | genome_name:CelG3 | 1 | 1 | JHB:1 | Mol:0 | 1 | Pip:3 | celg_id:1299 | woseq_id:17 | woname:WOPip3 | len:264 | 22.757576 |
| 2 | GC_00000112 | genome_name:CelG3 | 1 | 1 | JHB:1 | Mol:1 | 1 | Pip:1 | celg_id:1320 | woseq_id:48 | woname:WOPip1 | len:519 | 22.990366 |
| 3 | GC_00000111 | genome_name:CelG3 | 1 | 1 | JHB:1 | Mol:1 | 1 | Pip:3 | celg_id:1498 | woseq_id:15 | woname:WOPip3 | len:1302 | 24.525346 |
| 4 | GC_00000098 | genome_name:CelG3 | 1 | 1 | JHB:1 | Mol:1 | 2 | Pip:2 | celg_id:1332 | woseq_id:28 | woname:WOPip2 | len:1914 | 28.958725 |
| ... | ... | ... | ... | ... | ... | ... | ... | ... | ... | ... | ... | ... | ... |
| 109 | GC_00000027 | genome_name:CelG3 | 4 | 4 | JHB:3 | Mol:3 | 4 | Pip:1245 | celg_id:1178 | woseq_id:21 | woname:WOPip1 | len:1233 | 283.450933 |
| 110 | GC_00000007 | genome_name:CelG3 | 4 | 8 | JHB:10 | Mol:3 | 9 | Pip:15 | celg_id:1259 | woseq_id:1 | woname:WOPip5 | len:681 | 301.992658 |
| 111 | GC_00000019 | genome_name:CelG3 | 2 | 3 | JHB:9 | Mol:1 | 6 | Pip:45 | celg_id:784 | woseq_id:34 | woname:WOPip4 | len:948 | 329.422996 |
| 112 | GC_00000002 | genome_name:CelG3 | 4 | 40 | JHB:35 | Mol:9 | 52 | Pip:13 | celg_id:1323 | woseq_id:53 | woname:WOPip1 | len:1233 | 596.924574 |
| 113 | GC_00000001 | genome_name:CelG3 | 7 | 51 | JHB:54 | Mol:0 | 51 | Pip:1345 | celg_id:580 | woseq_id:0 | woname:WOPip1 | len:879 | 1698.784983 |
114 rows × 13 columns
# Import LinearRegression from scikit-learn for regression analysis.
from sklearn.linear_model import LinearRegression
# Prepare the feature matrix X using coverage values for regression.
X = numpy.array(df4['value']).reshape(-1, 1)
# Set the target variable y as the number of copies in CelG3.
y = df4[6] # nb copies in CelG3
# Fit a linear regression model to predict number of copies from coverage.
reg = LinearRegression().fit(X, df4[6])
# Predict the number of copies for a coverage value of 30 (1 copy).
reg.predict([[30]])
array([-0.09360229])
# Predict the number of copies for a coverage value of 60 (2 copies).
reg.predict([[60]])
array([0.90152668])
# Predict the number of copies for a coverage value of 180 (6 copies).
reg.predict([[180]])
array([4.88204258])
# Define a string format for displaying regression coefficients.
f2str = '{:.2f}'
Plotting Copy Number Predictions, Regression Score, Regression Equation
# Plot the scatter of coverage vs. number of copies and the regression line.
plt.scatter(X, y,color='g')
a = round(reg.coef_[0], 2)
b = round(reg.intercept_, 2)
label = '$%s x {%s}$' % tuple(f2str.format(t) for t in [a, b])
plt.plot(X, reg.predict(X),color='k')
plt.title('Number of copies in PipCelG against read coverage')
plt.xlabel('Sequence read coverage')
plt.ylabel('Number of copies')
plt.legend(['gene cluster', label], title=f'$R^2$ = {round(reg.score(X, y), 3)}')
plt.savefig('output_images/regression.pdf')
plt.show()
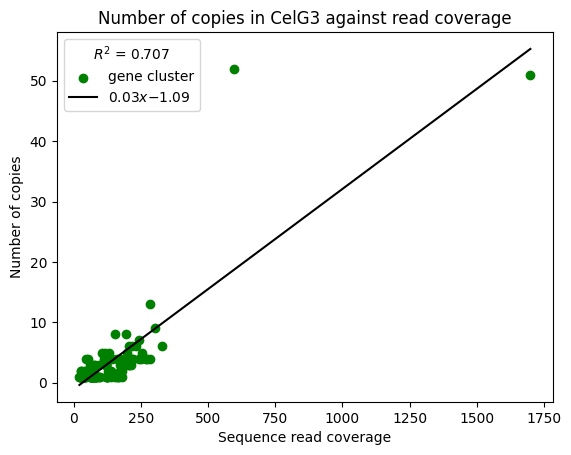
Since the intercept is of -1, you can add 1 to the prediction and round the value to get the actual number of copies.
# Predict the number of copies for a coverage value of 196 using the regression model.
reg.predict([[196]]) # 6
array([5.41277803])
reg.predict([[164.55]]) # 5
array([4.36955116])
reg.predict([[135.5]]) # 4
array([3.4059346])
reg.predict([[101.3]]) # 3
array([2.27148757])
reg.predict([[69.7]]) # 2
array([1.22328505])
reg.predict([[37.99]]) # 1
array([0.17143373])
Displaying Regression Parameters and Scores
# Display the regression coefficient (slope).
reg.coef_
array([0.03317097])
# Display the regression intercept.
reg.intercept_
-1.0887312648865013
# Display the R^2 score of the regression model (goodness of fit).
reg.score(X, y)
0.7067085085652323
Exploring Gene clusters with 4 or 5 copies
# Show gene clusters with 5 copies in column 2.
df4.loc[df4[2] == 5]
| 0 | 1 | 2 | 3 | 4 | 5 | 6 | 7 | 8 | 9 | 10 | 11 | value | |
|---|---|---|---|---|---|---|---|---|---|---|---|---|---|
| 93 | GC_00000018 | genome_name:CelG3 | 5 | 5 | JHB:4 | Mol:4 | 4 | Pip:12345 | celg_id:1189 | woseq_id:10 | woname:WOPip1 | len:477 | 202.607966 |
| 95 | GC_00000010 | genome_name:CelG3 | 5 | 5 | JHB:7 | Mol:5 | 6 | Pip:1245 | celg_id:1317 | woseq_id:45 | woname:WOPip1 | len:1026 | 204.800195 |
| 100 | GC_00000017 | genome_name:CelG3 | 5 | 5 | JHB:4 | Mol:4 | 4 | Pip:12345 | celg_id:1191 | woseq_id:8 | woname:WOPip1 | len:255 | 221.152941 |
| 101 | GC_00000015 | genome_name:CelG3 | 5 | 5 | JHB:3 | Mol:4 | 6 | Pip:12345 | celg_id:1185 | woseq_id:14 | woname:WOPip1 | len:372 | 230.545699 |
| 102 | GC_00000009 | genome_name:CelG3 | 5 | 6 | JHB:6 | Mol:4 | 7 | Pip:12345 | celg_id:1211 | woseq_id:20 | woname:WOPip4 | len:1062 | 243.768362 |
| 103 | GC_00000016 | genome_name:CelG3 | 5 | 5 | JHB:4 | Mol:4 | 4 | Pip:12345 | celg_id:1190 | woseq_id:9 | woname:WOPip1 | len:465 | 245.081720 |
| 104 | GC_00000023 | genome_name:CelG3 | 5 | 5 | JHB:4 | Mol:2 | 4 | Pip:12345 | celg_id:1186 | woseq_id:13 | woname:WOPip1 | len:1005 | 250.139303 |
| 106 | GC_00000020 | genome_name:CelG3 | 5 | 5 | JHB:5 | Mol:2 | 4 | Pip:12345 | celg_id:1188 | woseq_id:11 | woname:WOPip1 | len:426 | 269.363850 |
# Show gene clusters present in all 5 WO regions / where column 7 equals 'Pip:12345'.
df4.loc[df4[7] == 'Pip:12345']
| 0 | 1 | 2 | 3 | 4 | 5 | 6 | 7 | 8 | 9 | 10 | 11 | value | |
|---|---|---|---|---|---|---|---|---|---|---|---|---|---|
| 93 | GC_00000018 | genome_name:CelG3 | 5 | 5 | JHB:4 | Mol:4 | 4 | Pip:12345 | celg_id:1189 | woseq_id:10 | woname:WOPip1 | len:477 | 202.607966 |
| 100 | GC_00000017 | genome_name:CelG3 | 5 | 5 | JHB:4 | Mol:4 | 4 | Pip:12345 | celg_id:1191 | woseq_id:8 | woname:WOPip1 | len:255 | 221.152941 |
| 101 | GC_00000015 | genome_name:CelG3 | 5 | 5 | JHB:3 | Mol:4 | 6 | Pip:12345 | celg_id:1185 | woseq_id:14 | woname:WOPip1 | len:372 | 230.545699 |
| 102 | GC_00000009 | genome_name:CelG3 | 5 | 6 | JHB:6 | Mol:4 | 7 | Pip:12345 | celg_id:1211 | woseq_id:20 | woname:WOPip4 | len:1062 | 243.768362 |
| 103 | GC_00000016 | genome_name:CelG3 | 5 | 5 | JHB:4 | Mol:4 | 4 | Pip:12345 | celg_id:1190 | woseq_id:9 | woname:WOPip1 | len:465 | 245.081720 |
| 104 | GC_00000023 | genome_name:CelG3 | 5 | 5 | JHB:4 | Mol:2 | 4 | Pip:12345 | celg_id:1186 | woseq_id:13 | woname:WOPip1 | len:1005 | 250.139303 |
| 106 | GC_00000020 | genome_name:CelG3 | 5 | 5 | JHB:5 | Mol:2 | 4 | Pip:12345 | celg_id:1188 | woseq_id:11 | woname:WOPip1 | len:426 | 269.363850 |
# Count the number of gene clusters with 5 copies in column 2.
len(df4.loc[df4[2] == 5])
8
# Show gene clusters with 4 copies in column 2.
df4.loc[df4[2] == 4]
| 0 | 1 | 2 | 3 | 4 | 5 | 6 | 7 | 8 | 9 | 10 | 11 | value | |
|---|---|---|---|---|---|---|---|---|---|---|---|---|---|
| 47 | GC_00000029 | genome_name:CelG3 | 4 | 3 | JHB:5 | Mol:3 | 3 | Pip:1245 | celg_id:1407 | woseq_id:37 | woname:WOPip5 | len:825 | 75.843636 |
| 57 | GC_00000021 | genome_name:CelG3 | 4 | 4 | JHB:8 | Mol:4 | 1 | Pip:45 | celg_id:1385 | woseq_id:44 | woname:WOPip4 | len:555 | 96.095495 |
| 63 | GC_00000031 | genome_name:CelG3 | 4 | 4 | JHB:4 | Mol:3 | 3 | Pip:12 | celg_id:1452 | woseq_id:3 | woname:WOPip2 | len:2262 | 118.816976 |
| 72 | GC_00000013 | genome_name:CelG3 | 4 | 4 | JHB:5 | Mol:6 | 5 | Pip:1234 | celg_id:1194 | woseq_id:22 | woname:WOPip2 | len:1161 | 131.980189 |
| 89 | GC_00000033 | genome_name:CelG3 | 4 | 4 | JHB:3 | Mol:3 | 3 | Pip:1234 | celg_id:1192 | woseq_id:7 | woname:WOPip1 | len:336 | 195.214286 |
| 90 | GC_00000008 | genome_name:CelG3 | 4 | 7 | JHB:8 | Mol:3 | 8 | Pip:1235 | celg_id:1183 | woseq_id:16 | woname:WOPip1 | len:1419 | 195.592671 |
| 97 | GC_00000028 | genome_name:CelG3 | 4 | 4 | JHB:4 | Mol:3 | 3 | Pip:1234 | celg_id:1470 | woseq_id:6 | woname:WOPip1 | len:792 | 213.707071 |
| 98 | GC_00000011 | genome_name:CelG3 | 4 | 6 | JHB:7 | Mol:3 | 6 | Pip:1235 | celg_id:1181 | woseq_id:18 | woname:WOPip1 | len:1836 | 216.826797 |
| 99 | GC_00000034 | genome_name:CelG3 | 4 | 4 | JHB:3 | Mol:2 | 4 | Pip:1345 | celg_id:1187 | woseq_id:12 | woname:WOPip1 | len:306 | 218.790850 |
| 105 | GC_00000022 | genome_name:CelG3 | 4 | 5 | JHB:4 | Mol:2 | 5 | Pip:1235 | celg_id:1182 | woseq_id:17 | woname:WOPip1 | len:225 | 253.160000 |
| 107 | GC_00000035 | genome_name:CelG3 | 4 | 4 | JHB:5 | Mol:0 | 4 | Pip:1245 | celg_id:1177 | woseq_id:22 | woname:WOPip1 | len:465 | 274.580645 |
| 109 | GC_00000027 | genome_name:CelG3 | 4 | 4 | JHB:3 | Mol:3 | 4 | Pip:1245 | celg_id:1178 | woseq_id:21 | woname:WOPip1 | len:1233 | 283.450933 |
| 110 | GC_00000007 | genome_name:CelG3 | 4 | 8 | JHB:10 | Mol:3 | 9 | Pip:15 | celg_id:1259 | woseq_id:1 | woname:WOPip5 | len:681 | 301.992658 |
| 112 | GC_00000002 | genome_name:CelG3 | 4 | 40 | JHB:35 | Mol:9 | 52 | Pip:13 | celg_id:1323 | woseq_id:53 | woname:WOPip1 | len:1233 | 596.924574 |
Clean Columns for Further Analysis
# Create a copy of df4 sorted by coverage value in descending order and reset index.
df5 = df4.copy().sort_values('value', ascending=False).reset_index(drop=True)
# Add a column to df5 with predicted number of copies in CelG3 based on coverage.
df5['predicted nb copies in celG'] = df5['value'].apply(lambda x: round(reg.predict([[x]])[0])+1)
# Display the last 30 rows of df5 for inspection.
df5.tail(30)
| 0 | 1 | 2 | 3 | 4 | 5 | 6 | 7 | 8 | 9 | 10 | 11 | value | predicted nb copies in celG | |
|---|---|---|---|---|---|---|---|---|---|---|---|---|---|---|
| 84 | GC_00000114 | genome_name:CelG3 | 1 | 1 | JHB:1 | Mol:1 | 1 | Pip:4 | celg_id:1228 | woseq_id:3 | woname:WOPip4 | len:1014 | 60.861933 | 2 |
| 85 | GC_00000126 | genome_name:CelG3 | 1 | 1 | JHB:1 | Mol:1 | 1 | Pip:4 | celg_id:1227 | woseq_id:4 | woname:WOPip4 | len:2757 | 60.248096 | 2 |
| 86 | GC_00000093 | genome_name:CelG3 | 1 | 1 | JHB:1 | Mol:1 | 2 | Pip:4 | celg_id:1209 | woseq_id:22 | woname:WOPip4 | len:1884 | 57.966561 | 2 |
| 87 | GC_00000094 | genome_name:CelG3 | 1 | 1 | JHB:1 | Mol:1 | 2 | Pip:2 | celg_id:1453 | woseq_id:4 | woname:WOPip2 | len:3537 | 55.020074 | 2 |
| 88 | GC_00000052 | genome_name:CelG3 | 2 | 2 | JHB:1 | Mol:3 | 4 | Pip:2 | celg_id:1326 | woseq_id:31 | woname:WOPip2 | len:5985 | 52.042272 | 2 |
| 89 | GC_00000087 | genome_name:CelG3 | 1 | 1 | JHB:1 | Mol:3 | 1 | Pip:5 | celg_id:1170 | woseq_id:4 | woname:WOPip5 | len:3633 | 46.599505 | 1 |
| 90 | GC_00000096 | genome_name:CelG3 | 1 | 1 | JHB:1 | Mol:1 | 2 | Pip:5 | celg_id:1167 | woseq_id:2 | woname:WOPip5 | len:3483 | 44.989664 | 1 |
| 91 | GC_00000041 | genome_name:CelG3 | 2 | 2 | JHB:4 | Mol:3 | 4 | Pip:34 | celg_id:1484 | woseq_id:47 | woname:WOPip4 | len:375 | 44.661333 | 1 |
| 92 | GC_00000092 | genome_name:CelG3 | 1 | 1 | JHB:1 | Mol:2 | 1 | Pip:4 | celg_id:1204 | woseq_id:27 | woname:WOPip4 | len:2058 | 42.702624 | 1 |
| 93 | GC_00000184 | genome_name:CelG3 | 1 | 1 | JHB:1 | Mol:1 | 1 | Pip:4 | celg_id:2 | woseq_id:58 | woname:WOPip4 | len:2097 | 41.699571 | 1 |
| 94 | GC_00000118 | genome_name:CelG3 | 1 | 1 | JHB:1 | Mol:1 | 1 | Pip:4 | celg_id:3 | woseq_id:59 | woname:WOPip4 | len:264 | 39.852273 | 1 |
| 95 | GC_00000133 | genome_name:CelG3 | 1 | 1 | JHB:1 | Mol:1 | 1 | Pip:5 | celg_id:1171 | woseq_id:5 | woname:WOPip5 | len:468 | 38.059829 | 1 |
| 96 | GC_00000085 | genome_name:CelG3 | 1 | 1 | JHB:1 | Mol:2 | 2 | Pip:5 | celg_id:1174 | woseq_id:7 | woname:WOPip5 | len:10353 | 37.945426 | 1 |
| 97 | GC_00000130 | genome_name:CelG3 | 1 | 1 | JHB:1 | Mol:1 | 1 | Pip:2 | celg_id:1334 | woseq_id:27 | woname:WOPip2 | len:1944 | 37.737140 | 1 |
| 98 | GC_00000124 | genome_name:CelG3 | 1 | 1 | JHB:1 | Mol:1 | 1 | Pip:4 | celg_id:5 | woseq_id:61 | woname:WOPip4 | len:1245 | 37.465060 | 1 |
| 99 | GC_00000115 | genome_name:CelG3 | 1 | 1 | JHB:1 | Mol:1 | 1 | Pip:4 | celg_id:4 | woseq_id:60 | woname:WOPip4 | len:411 | 37.447689 | 1 |
| 100 | GC_00000863 | genome_name:CelG3 | 1 | 1 | JHB:1 | Mol:0 | 1 | Pip:3 | celg_id:1292 | woseq_id:25 | woname:WOPip3 | len:546 | 33.987179 | 1 |
| 101 | GC_00000619 | genome_name:CelG3 | 1 | 1 | JHB:1 | Mol:0 | 1 | Pip:4 | celg_id:1481 | woseq_id:51 | woname:WOPip4 | len:333 | 33.219219 | 1 |
| 102 | GC_00000117 | genome_name:CelG3 | 1 | 1 | JHB:1 | Mol:1 | 1 | Pip:4 | celg_id:1203 | woseq_id:28 | woname:WOPip4 | len:501 | 32.928144 | 1 |
| 103 | GC_00000680 | genome_name:CelG3 | 1 | 1 | JHB:1 | Mol:0 | 1 | Pip:3 | celg_id:1290 | woseq_id:27 | woname:WOPip3 | len:2367 | 31.897338 | 1 |
| 104 | GC_00000668 | genome_name:CelG3 | 1 | 1 | JHB:1 | Mol:0 | 1 | Pip:3 | celg_id:1291 | woseq_id:26 | woname:WOPip3 | len:135 | 31.674074 | 1 |
| 105 | GC_00000474 | genome_name:CelG3 | 1 | 1 | JHB:1 | Mol:0 | 1 | Pip:3 | celg_id:1289 | woseq_id:28 | woname:WOPip3 | len:1815 | 31.406612 | 1 |
| 106 | GC_00000097 | genome_name:CelG3 | 1 | 1 | JHB:1 | Mol:1 | 2 | Pip:2 | celg_id:1331 | woseq_id:29 | woname:WOPip2 | len:1035 | 29.202899 | 1 |
| 107 | GC_00000089 | genome_name:CelG3 | 2 | 2 | JHB:1 | Mol:1 | 1 | Pip:3 | celg_id:1293 | woseq_id:23 | woname:WOPip3 | len:4122 | 29.117419 | 1 |
| 108 | GC_00000127 | genome_name:CelG3 | 1 | 1 | JHB:1 | Mol:1 | 1 | Pip:3 | celg_id:1497 | woseq_id:14 | woname:WOPip3 | len:330 | 29.015152 | 1 |
| 109 | GC_00000098 | genome_name:CelG3 | 1 | 1 | JHB:1 | Mol:1 | 2 | Pip:2 | celg_id:1332 | woseq_id:28 | woname:WOPip2 | len:1914 | 28.958725 | 1 |
| 110 | GC_00000111 | genome_name:CelG3 | 1 | 1 | JHB:1 | Mol:1 | 1 | Pip:3 | celg_id:1498 | woseq_id:15 | woname:WOPip3 | len:1302 | 24.525346 | 1 |
| 111 | GC_00000112 | genome_name:CelG3 | 1 | 1 | JHB:1 | Mol:1 | 1 | Pip:1 | celg_id:1320 | woseq_id:48 | woname:WOPip1 | len:519 | 22.990366 | 1 |
| 112 | GC_00000192 | genome_name:CelG3 | 1 | 1 | JHB:1 | Mol:0 | 1 | Pip:3 | celg_id:1299 | woseq_id:17 | woname:WOPip3 | len:264 | 22.757576 | 1 |
| 113 | GC_00000120 | genome_name:CelG3 | 1 | 1 | JHB:1 | Mol:1 | 1 | Pip:1 | celg_id:1321 | woseq_id:49 | woname:WOPip1 | len:411 | 21.776156 | 1 |
# Rename columns in df5 for clarity and downstream analysis.
df5.columns = ['gene_cluster_id', 'genome_name', 'nb_copies_in_WO_description', 'nb_copies_in_PipPel', 'nb_copies_in_JHB', 'nb_copies_in_PipMol', 'nb_copies_in_CelG3', 'WOPip_number_sequence',  'CelG3_id', 'WOseq_id', "wo_name", 'length', 'coverage_in_CelG3', 'predicted_nb_copies_in_CelG3']
# Clean up several columns in df5 by extracting numeric or string values after ':'.
df5['CelG3_id'] = df5['CelG3_id'].apply(lambda x: int(x[x.index(':')+1:]))
df5['genome_name'] = df5['genome_name'].apply(lambda x: str(x[x.index(':')+1:]))
df5['WOseq_id'] = df5['WOseq_id'].apply(lambda x: int(x[x.index(':')+1:]))
df5['nb_copies_in_PipMol'] = df5['nb_copies_in_PipMol'].apply(lambda x: str(x[x.index(':')+1:]))
df5['nb_copies_in_JHB'] = df5['nb_copies_in_JHB'].apply(lambda x: str(x[x.index(':')+1:]))
#df5['nb_copies_in_CelG3'] = df5['nb_copies_in_CelG3'].apply(lambda x: str(x[x.index(':')+1:]))
df5['length'] = df5['length'].apply(lambda x: int(x[x.index(':')+1:]))
df5['wo_name'] = df5['wo_name'].apply(lambda x: str(x[x.index(':')+1:]))
# Display the cleaned and renamed DataFrame df5.
df5
| gene_cluster_id | genome_name | nb_copies_in_WO_description | nb_copies_in_PipPel | nb_copies_in_JHB | nb_copies_in_PipMol | nb_copies_in_CelG3 | WOPip_number_sequence | CelG3_id | WOseq_id | wo_name | length | coverage_in_CelG3 | predicted_nb_copies_in_CelG3 | |
|---|---|---|---|---|---|---|---|---|---|---|---|---|---|---|
| 0 | GC_00000001 | CelG3 | 7 | 51 | 54 | 0 | 51 | Pip:1345 | 580 | 0 | WOPip1 | 879 | 1698.784983 | 56 |
| 1 | GC_00000002 | CelG3 | 4 | 40 | 35 | 9 | 52 | Pip:13 | 1323 | 53 | WOPip1 | 1233 | 596.924574 | 20 |
| 2 | GC_00000019 | CelG3 | 2 | 3 | 9 | 1 | 6 | Pip:45 | 784 | 34 | WOPip4 | 948 | 329.422996 | 11 |
| 3 | GC_00000007 | CelG3 | 4 | 8 | 10 | 3 | 9 | Pip:15 | 1259 | 1 | WOPip5 | 681 | 301.992658 | 10 |
| 4 | GC_00000027 | CelG3 | 4 | 4 | 3 | 3 | 4 | Pip:1245 | 1178 | 21 | WOPip1 | 1233 | 283.450933 | 9 |
| ... | ... | ... | ... | ... | ... | ... | ... | ... | ... | ... | ... | ... | ... | ... |
| 109 | GC_00000098 | CelG3 | 1 | 1 | 1 | 1 | 2 | Pip:2 | 1332 | 28 | WOPip2 | 1914 | 28.958725 | 1 |
| 110 | GC_00000111 | CelG3 | 1 | 1 | 1 | 1 | 1 | Pip:3 | 1498 | 15 | WOPip3 | 1302 | 24.525346 | 1 |
| 111 | GC_00000112 | CelG3 | 1 | 1 | 1 | 1 | 1 | Pip:1 | 1320 | 48 | WOPip1 | 519 | 22.990366 | 1 |
| 112 | GC_00000192 | CelG3 | 1 | 1 | 1 | 0 | 1 | Pip:3 | 1299 | 17 | WOPip3 | 264 | 22.757576 | 1 |
| 113 | GC_00000120 | CelG3 | 1 | 1 | 1 | 1 | 1 | Pip:1 | 1321 | 49 | WOPip1 | 411 | 21.776156 | 1 |
114 rows × 14 columns
5. Functional Annotation and Grouping
Getting back Functional Annotations from the Pangenome Analysis, Merging with Coverage Data
# Create a copy of new_df for further analysis.
new_df_interest = new_df.copy()
# Drop unnecessary columns from new_df_interest and rename 'length' to 'aa_length'.
new_df_interest = new_df_interest.drop(['num_genomes_gene_cluster_has_hits', 'bin_name', 'num_genes_in_gene_cluster', 'num_genomes_gene_cluster_has_hits',
                      'SCG', 'functional_homogeneity_index', 'geometric_homogeneity_index', 'combined_homogeneity_index'], axis=1).rename({'length': 'aa_length'}, axis=1)
# Display the cleaned new_df_interest DataFrame.
new_df_interest
| gene_cluster_id | genome_name | gene_callers_id | max_num_paralogs | COG20_FUNCTION_ACC | COG20_FUNCTION | COG20_CATEGORY_ACC | COG20_CATEGORY | aa_sequence | aa_length | all_call_ids | contigs | |
|---|---|---|---|---|---|---|---|---|---|---|---|---|
| 0 | GC_00000001 | CelG3 | 580 | 54 | COG3293 | Transposase | X | Mobilome: prophages, transposons | MKKDITELYCCVEDFCRAVDDNFANRFLSNGKKPTRVPEIAHSEIL... | 292 | [30, 60, 79, 98, 146, 219, 294, 410, 449, 476,... | [contig_22, contig_3, contig_2] |
| 1 | GC_00000002 | CelG3 | 1323 | 52 | COG3328 | Transposase (or an inactivated derivative) (IS... | X | Mobilome: prophages, transposons | ----------MSQKVVNRTTGLVDYKELETNILSSIREGRPLTGRD... | 410 | [10, 370, 446, 770, 809, 831, 921, 973, 994, 1... | [contig_1, contig_3, contig_2, contig_10] |
| 2 | GC_00000003 | CelG3 | 1403 | 22 | COG3335|COG3415 | Transposase|CRISPR-associated protein Csa3, CA... | X|V | Mobilome: prophages, transposons|Defense mecha... | ---------------------------MPAAYSYDLRKKAMEVLEE... | 285 | [1104, 1403, 959, 1373, 136, 137, 924, 478, 96... | [contig_22, contig_13, contig_2] |
| 3 | GC_00000007 | CelG3 | 1259 | 10 | COG3316 | Transposase (or an inactivated derivative), DD... | X | Mobilome: prophages, transposons | MFRISSKLLPYFKGFSFSAEIIMLSVYMKCRFSLSYRDLEEMLSIR... | 226 | [1145, 1166, 1273, 1322, 1143, 1235, 1259, 110... | [contig_3, contig_2, contig_10] |
| 4 | GC_00000008 | CelG3 | 1183 | 8 | COG5511 | Phage capsid protein | X | Mobilome: prophages, transposons | MLLKTFKQLFNKPKIKSSAWDTAGSGRRFFHFQPELGSINNLLSQS... | 472 | [1183, 1460, 1476, 1418, 1507, 1264, 1157, 1262] | [contig_22, contig_23, contig_19, contig_14, c... |
| ... | ... | ... | ... | ... | ... | ... | ... | ... | ... | ... | ... | ... |
| 109 | GC_00000680 | CelG3 | 1290 | 1 | NaN | NaN | NaN | NaN | MVHSSAQIFTKFDNDSKQRNIEGLEKTYLGVLLSIELNSKTSQIAK... | 788 | [1290] | [contig_3] |
| 110 | GC_00000863 | CelG3 | 1292 | 1 | NaN | NaN | NaN | NaN | MFSFVTIAFSCAAISKNNTIAEKKDQLNQQSNEIASLKKQLDEKEI... | 181 | [1292] | [contig_3] |
| 111 | GC_00001024 | CelG3 | 1409 | 1 | NaN | NaN | NaN | NaN | -------------------------------------------MVY... | 80 | [1409] | [contig_22] |
| 112 | GC_00001077 | CelG3 | 1370 | 1 | COG4467 | Regulator of replication initiation timing Yab... | L | Replication, recombination and repair | -MISIVELCKNLEQKVAKLEEKNKILEIENAELRERLGLNSRNSSL... | 450 | [1370] | [contig_15] |
| 113 | GC_00001099 | CelG3 | 1433 | 1 | NaN | NaN | NaN | NaN | MHQVEIVSKFKEVKVGNLFFSTCSNFSKSICVELGKVEGGS | 41 | [1433] | [contig_22] |
114 rows × 12 columns
# Merge df5 and new_df_interest on gene_cluster_id and genome_name.
merged_df = pandas.merge(df5, new_df_interest, on=['gene_cluster_id', 'genome_name'])
# Save the merged DataFrame to a CSV file for downstream analysis.
merged_df.to_csv('CelG3_all_WO_genes.csv', index=None)
# Create a copy of merged_df for further manipulation.
df6 = merged_df.copy()
# Display the copied DataFrame df6.
df6
| gene_cluster_id | genome_name | nb_copies_in_WO_description | nb_copies_in_PipPel | nb_copies_in_JHB | nb_copies_in_PipMol | nb_copies_in_CelG3 | WOPip_number_sequence | CelG3_id | WOseq_id | ... | gene_callers_id | max_num_paralogs | COG20_FUNCTION_ACC | COG20_FUNCTION | COG20_CATEGORY_ACC | COG20_CATEGORY | aa_sequence | aa_length | all_call_ids | contigs | |
|---|---|---|---|---|---|---|---|---|---|---|---|---|---|---|---|---|---|---|---|---|---|
| 0 | GC_00000001 | CelG3 | 7 | 51 | 54 | 0 | 51 | Pip:1345 | 580 | 0 | ... | 580 | 54 | COG3293 | Transposase | X | Mobilome: prophages, transposons | MKKDITELYCCVEDFCRAVDDNFANRFLSNGKKPTRVPEIAHSEIL... | 292 | [30, 60, 79, 98, 146, 219, 294, 410, 449, 476,... | [contig_22, contig_3, contig_2] |
| 1 | GC_00000002 | CelG3 | 4 | 40 | 35 | 9 | 52 | Pip:13 | 1323 | 53 | ... | 1323 | 52 | COG3328 | Transposase (or an inactivated derivative) (IS... | X | Mobilome: prophages, transposons | ----------MSQKVVNRTTGLVDYKELETNILSSIREGRPLTGRD... | 410 | [10, 370, 446, 770, 809, 831, 921, 973, 994, 1... | [contig_1, contig_3, contig_2, contig_10] |
| 2 | GC_00000019 | CelG3 | 2 | 3 | 9 | 1 | 6 | Pip:45 | 784 | 34 | ... | 784 | 9 | COG3547 | Transposase | X | Mobilome: prophages, transposons | MITSYQNFIGIDIGKFKNVVAVHEQKNTVGFDNNTSGWQQLFQKFS... | 315 | [784, 1094, 1172, 1339, 1354, 1499] | [contig_8, contig_2, contig_9] |
| 3 | GC_00000007 | CelG3 | 4 | 8 | 10 | 3 | 9 | Pip:15 | 1259 | 1 | ... | 1259 | 10 | COG3316 | Transposase (or an inactivated derivative), DD... | X | Mobilome: prophages, transposons | MFRISSKLLPYFKGFSFSAEIIMLSVYMKCRFSLSYRDLEEMLSIR... | 226 | [1145, 1166, 1273, 1322, 1143, 1235, 1259, 110... | [contig_3, contig_2, contig_10] |
| 4 | GC_00000027 | CelG3 | 4 | 4 | 3 | 3 | 4 | Pip:1245 | 1178 | 21 | ... | 1178 | 4 | COG0863|COG1475 | DNA modification methylase (YhdJ) (PDB:1BOO)|C... | L|D | Replication, recombination and repair|Cell cyc... | MNLAIHYYPTRDLVEYERNPRKNDDVVNRMCASIREFGFRIPIVAK... | 410 | [1178, 1412, 1455, 1208] | [contig_22, contig_23, contig_14, contig_3] |
| ... | ... | ... | ... | ... | ... | ... | ... | ... | ... | ... | ... | ... | ... | ... | ... | ... | ... | ... | ... | ... | ... |
| 109 | GC_00000098 | CelG3 | 1 | 1 | 1 | 1 | 2 | Pip:2 | 1332 | 28 | ... | 1332 | 2 | NaN | NaN | NaN | NaN | MPSNVKPLELVQLLLMRNKSKDEFLDFQKRFQSFINQSPSFLHSVG... | 637 | [1332, 1333] | [contig_10] |
| 110 | GC_00000111 | CelG3 | 1 | 1 | 1 | 1 | 1 | Pip:3 | 1498 | 15 | ... | 1498 | 1 | COG3344 | Retron-type reverse transcriptase (YkfC) | X | Mobilome: prophages, transposons | MQDKLNQIAVRAKQDKRLKFTSLIHLINVGNLAECYKELKRNKACG... | 433 | [1498] | [contig_27] |
| 111 | GC_00000112 | CelG3 | 1 | 1 | 1 | 1 | 1 | Pip:1 | 1320 | 48 | ... | 1320 | 1 | COG3335|COG3415 | Transposase|CRISPR-associated protein Csa3, CA... | X|V | Mobilome: prophages, transposons|Defense mecha... | MALRSKLLDEKVVNLAKEMLKKVRNNAYVSKKLQAVIAGKESSISA... | 172 | [1320] | [contig_10] |
| 112 | GC_00000192 | CelG3 | 1 | 1 | 1 | 0 | 1 | Pip:3 | 1299 | 17 | ... | 1299 | 1 | COG0666 | Ankyrin repeat (ANKYR) (PDB:6AUN) | T | Signal transduction mechanisms | MLKLGKFNKSAKELLENSYKNIYARDENGRTALHYAINAKTVRVLV... | 87 | [1299] | [contig_3] |
| 113 | GC_00000120 | CelG3 | 1 | 1 | 1 | 1 | 1 | Pip:1 | 1321 | 49 | ... | 1321 | 1 | COG3335|COG3415 | Transposase|CRISPR-associated protein Csa3, CA... | X|V | Mobilome: prophages, transposons|Defense mecha... | MKIGRQNFYIYSAVNPRSGKKISLLAPYVNTDCMNIFLEQMSKDLG... | 136 | [1321] | [contig_10] |
114 rows × 24 columns
Getting our Manually-Curated Functional Annotations, Merging with Coverage Data
# Load Excel file with manually curated WO phage annotations from Blandine and Maxime (adapted from Bordenstein and Bordenstein, 2022).
bld = pandas.read_excel('../../../Prophage_WO_annotation_From-Blandine_Maxime_July_17.xlsx',sheet_name=None)
# Concatenate all sheets from the loaded Excel file into a single DataFrame.
concatenated_df = pandas.concat(
    {sheet_name: sheet_df for sheet_name, sheet_df in bld.items()},
    axis=0
)
# Reset index and rename columns for easier merging and analysis.
bld2 = concatenated_df.reset_index().drop('level_0', axis=1).rename({'level_1':'WOseq_id', 'Prophage': 'wo_name'}, axis=1)
# Display the cleaned annotation DataFrame bld2.
bld2
| WOseq_id | wo_name | start | stop | length | orientation | COG | Name | Product | |
|---|---|---|---|---|---|---|---|---|---|
| 0 | 0 | WOPip1 | 134 | 1006 | 873 | + | COG3293 | Transposase | Transposase |
| 1 | 1 | WOPip1 | 1302 | 1577 | 276 | - | COG2003 | Other repair | DNA repair protein RadC, contains a helix-hair... |
| 2 | 2 | WOPip1 | 1742 | 2659 | 918 | - | COG1396 | Transcriptional regulator | Transcriptional regulator, contains XRE-family... |
| 3 | 3 | WOPip1 | 2780 | 3673 | 894 | + | COG1317 | Transposase | Flagellar biosynthesis/type III secretory path... |
| 4 | 4 | WOPip1 | 4035 | 4595 | 561 | - | NaN | NaN | NaN |
| ... | ... | ... | ... | ... | ... | ... | ... | ... | ... |
| 243 | 60 | WOPip5 | 70244 | 72226 | 1983 | - | COG0666 | ANKYR | Ankyrin repeat (ANKYR) (PDB:6AUN) |
| 244 | 61 | WOPip5 | 72958 | 73083 | 126 | - | NaN | NaN | NaN |
| 245 | 62 | WOPip5 | 73122 | 73400 | 279 | - | NaN | Cytoplasmic incompatibility | cidB(trunc) |
| 246 | 63 | WOPip5 | 73637 | 74698 | 1062 | + | NaN | Cytoplasmic incompatibility | cidB(trunc) |
| 247 | 64 | WOPip5 | 75832 | 76704 | 873 | + | COG3293 | Transposase | Transposase |
248 rows × 9 columns
# Merge df6 and bld2 on 'wo_name' and 'WOseq_id' to add functional annotations to gene clusters.
merged_df = pandas.merge(df6, bld2, on=['wo_name', 'WOseq_id'], how='inner')
# Rename columns for clarity: 'length_x' becomes 'celg_length', 'length_y' becomes 'wo_length'.
merged_df = merged_df.rename({'length_x': 'celg_length', 'length_y': 'wo_length'}, axis=1)
# Display the merged DataFrame with annotations and gene cluster info.
merged_df
| gene_cluster_id | genome_name | nb_copies_in_WO_description | nb_copies_in_PipPel | nb_copies_in_JHB | nb_copies_in_PipMol | nb_copies_in_CelG3 | WOPip_number_sequence | CelG3_id | WOseq_id | ... | aa_length | all_call_ids | contigs | start | stop | wo_length | orientation | COG | Name | Product | |
|---|---|---|---|---|---|---|---|---|---|---|---|---|---|---|---|---|---|---|---|---|---|
| 0 | GC_00000001 | CelG3 | 7 | 51 | 54 | 0 | 51 | Pip:1345 | 580 | 0 | ... | 292 | [30, 60, 79, 98, 146, 219, 294, 410, 449, 476,... | [contig_22, contig_3, contig_2] | 134 | 1006 | 873 | + | COG3293 | Transposase | Transposase |
| 1 | GC_00000002 | CelG3 | 4 | 40 | 35 | 9 | 52 | Pip:13 | 1323 | 53 | ... | 410 | [10, 370, 446, 770, 809, 831, 921, 973, 994, 1... | [contig_1, contig_3, contig_2, contig_10] | 49816 | 50484 | 669 | - | COG3328 | Transposase | Transposase (or an inactivated derivative) (IS... |
| 2 | GC_00000019 | CelG3 | 2 | 3 | 9 | 1 | 6 | Pip:45 | 784 | 34 | ... | 315 | [784, 1094, 1172, 1339, 1354, 1499] | [contig_8, contig_2, contig_9] | 41328 | 42275 | 948 | - | COG3547 | Transposase | Transposase |
| 3 | GC_00000007 | CelG3 | 4 | 8 | 10 | 3 | 9 | Pip:15 | 1259 | 1 | ... | 226 | [1145, 1166, 1273, 1322, 1143, 1235, 1259, 110... | [contig_3, contig_2, contig_10] | 593 | 1015 | 423 | + | COG3316 | Transposase | Transposase (or an inactivated derivative), DD... |
| 4 | GC_00000027 | CelG3 | 4 | 4 | 3 | 3 | 4 | Pip:1245 | 1178 | 21 | ... | 410 | [1178, 1412, 1455, 1208] | [contig_22, contig_23, contig_14, contig_3] | 16130 | 17362 | 1233 | - | COG0863 | Methylase | DNA modification methylase (YhdJ) (PDB:1BOO) |
| ... | ... | ... | ... | ... | ... | ... | ... | ... | ... | ... | ... | ... | ... | ... | ... | ... | ... | ... | ... | ... | ... |
| 109 | GC_00000098 | CelG3 | 1 | 1 | 1 | 1 | 2 | Pip:2 | 1332 | 28 | ... | 637 | [1332, 1333] | [contig_10] | 29147 | 31345 | 2199 | - | NaN | Cytoplasmic incompatibility | Potential cid |
| 110 | GC_00000111 | CelG3 | 1 | 1 | 1 | 1 | 1 | Pip:3 | 1498 | 15 | ... | 433 | [1498] | [contig_27] | 10127 | 11428 | 1302 | + | COG3344 | Reverse transcriptase | Retron-type reverse transcriptase (YkfC) |
| 111 | GC_00000112 | CelG3 | 1 | 1 | 1 | 1 | 1 | Pip:1 | 1320 | 48 | ... | 172 | [1320] | [contig_10] | 47490 | 48008 | 519 | + | COG3335 | Transposase | Transposase |
| 112 | GC_00000192 | CelG3 | 1 | 1 | 1 | 0 | 1 | Pip:3 | 1299 | 17 | ... | 87 | [1299] | [contig_3] | 12291 | 12764 | 474 | + | COG0666 | ANKYR | Ankyrin repeat (ANKYR) (PDB:6AUN) |
| 113 | GC_00000120 | CelG3 | 1 | 1 | 1 | 1 | 1 | Pip:1 | 1321 | 49 | ... | 136 | [1321] | [contig_10] | 48082 | 48492 | 411 | + | COG3335 | Transposase | Transposase |
114 rows × 31 columns
# Show all gene clusters annotated as 'ANKYR'.
merged_df.loc[merged_df['Name'] == 'ANKYR']
| gene_cluster_id | genome_name | nb_copies_in_WO_description | nb_copies_in_PipPel | nb_copies_in_JHB | nb_copies_in_PipMol | nb_copies_in_CelG3 | WOPip_number_sequence | CelG3_id | WOseq_id | ... | aa_length | all_call_ids | contigs | start | stop | wo_length | orientation | COG | Name | Product | |
|---|---|---|---|---|---|---|---|---|---|---|---|---|---|---|---|---|---|---|---|---|---|
| 21 | GC_00000043 | CelG3 | 3 | 3 | 2 | 1 | 4 | Pip:125 | 1180 | 19 | ... | 490 | [1180, 1414, 1457, 1491] | [contig_22, contig_23, contig_14, contig_17] | 14177 | 15649 | 1473 | - | COG0666 | ANKYR | Ankyrin repeat (ANKYR) (PDB:6AUN) |
| 28 | GC_00000057 | CelG3 | 1 | 1 | 5 | 2 | 2 | Pip:1 | 1379 | 39 | ... | 397 | [1379, 1308] | [contig_13, contig_24] | 33003 | 34196 | 1194 | - | COG0666 | ANKYR | Ankyrin repeat (ANKYR) (PDB:6AUN) |
| 48 | GC_00000045 | CelG3 | 3 | 3 | 3 | 1 | 3 | Pip:234 | 1195 | 16 | ... | 236 | [1195, 1223, 1300] | [contig_23, contig_3] | 11440 | 12252 | 813 | + | COG0666 | ANKYR | Ankyrin repeat (ANKYR) (PDB:6AUN) |
| 53 | GC_00000053 | CelG3 | 2 | 2 | 2 | 1 | 4 | Pip:24 | 1224 | 24 | ... | 149 | [1224, 1196, 1298, 1337] | [contig_3, contig_10, contig_23] | 23708 | 24157 | 450 | + | COG0666 | ANKYR | Ankyrin repeat (ANKYR) (PDB:6AUN) |
| 59 | GC_00000095 | CelG3 | 1 | 1 | 2 | 1 | 1 | Pip:5 | 1432 | 60 | ... | 660 | [1432] | [contig_22] | 70244 | 72226 | 1983 | - | COG0666 | ANKYR | Ankyrin repeat (ANKYR) (PDB:6AUN) |
| 68 | GC_00000063 | CelG3 | 2 | 2 | 2 | 2 | 2 | Pip:45 | 1479 | 53 | ... | 347 | [1479, 1478] | [contig_38] | 56872 | 58113 | 1242 | - | COG0666 | ANKYR | Ankyrin repeat (ANKYR) (PDB:6AUN) |
| 80 | GC_00000099 | CelG3 | 1 | 1 | 1 | 0 | 3 | Pip:4 | 1229 | 2 | ... | 1488 | [1229, 1230, 1276] | [contig_3] | 1326 | 9188 | 7863 | - | COG0457 | ANKYR | Tetratricopeptide (TPR) repeat (TPR) (PDB:3AS4) |
| 88 | GC_00000052 | CelG3 | 2 | 2 | 1 | 3 | 4 | Pip:2 | 1326 | 31 | ... | 1994 | [1329, 1328, 1326, 1327] | [contig_10] | 39348 | 47594 | 8247 | + | COG0666 | ANKYR | Ankyrin repeat (ANKYR) (PDB:6AUN) |
| 91 | GC_00000041 | CelG3 | 2 | 2 | 4 | 3 | 4 | Pip:34 | 1484 | 47 | ... | 124 | [1484, 1304, 1287, 1383] | [contig_3, contig_7, contig_38, contig_24] | 52789 | 53313 | 525 | + | COG0666 | ANKYR | Ankyrin repeat (ANKYR) (PDB:6AUN) |
| 97 | GC_00000130 | CelG3 | 1 | 1 | 1 | 1 | 1 | Pip:2 | 1334 | 27 | ... | 647 | [1334] | [contig_10] | 26551 | 28497 | 1947 | - | COG0666 | ANKYR | Ankyrin repeat (ANKYR) (PDB:6AUN) |
| 112 | GC_00000192 | CelG3 | 1 | 1 | 1 | 0 | 1 | Pip:3 | 1299 | 17 | ... | 87 | [1299] | [contig_3] | 12291 | 12764 | 474 | + | COG0666 | ANKYR | Ankyrin repeat (ANKYR) (PDB:6AUN) |
11 rows × 31 columns
# Show all gene clusters annotated as 'Transposase'.
merged_df.loc[merged_df['Name'] == 'Transposase']
| gene_cluster_id | genome_name | nb_copies_in_WO_description | nb_copies_in_PipPel | nb_copies_in_JHB | nb_copies_in_PipMol | nb_copies_in_CelG3 | WOPip_number_sequence | CelG3_id | WOseq_id | ... | aa_length | all_call_ids | contigs | start | stop | wo_length | orientation | COG | Name | Product | |
|---|---|---|---|---|---|---|---|---|---|---|---|---|---|---|---|---|---|---|---|---|---|
| 0 | GC_00000001 | CelG3 | 7 | 51 | 54 | 0 | 51 | Pip:1345 | 580 | 0 | ... | 292 | [30, 60, 79, 98, 146, 219, 294, 410, 449, 476,... | [contig_22, contig_3, contig_2] | 134 | 1006 | 873 | + | COG3293 | Transposase | Transposase |
| 1 | GC_00000002 | CelG3 | 4 | 40 | 35 | 9 | 52 | Pip:13 | 1323 | 53 | ... | 410 | [10, 370, 446, 770, 809, 831, 921, 973, 994, 1... | [contig_1, contig_3, contig_2, contig_10] | 49816 | 50484 | 669 | - | COG3328 | Transposase | Transposase (or an inactivated derivative) (IS... |
| 2 | GC_00000019 | CelG3 | 2 | 3 | 9 | 1 | 6 | Pip:45 | 784 | 34 | ... | 315 | [784, 1094, 1172, 1339, 1354, 1499] | [contig_8, contig_2, contig_9] | 41328 | 42275 | 948 | - | COG3547 | Transposase | Transposase |
| 3 | GC_00000007 | CelG3 | 4 | 8 | 10 | 3 | 9 | Pip:15 | 1259 | 1 | ... | 226 | [1145, 1166, 1273, 1322, 1143, 1235, 1259, 110... | [contig_3, contig_2, contig_10] | 593 | 1015 | 423 | + | COG3316 | Transposase | Transposase (or an inactivated derivative), DD... |
| 5 | GC_00000003 | CelG3 | 2 | 13 | 22 | 5 | 13 | Pip:1 | 1403 | 33 | ... | 285 | [1104, 1403, 959, 1373, 136, 137, 924, 478, 96... | [contig_22, contig_13, contig_2] | 28856 | 29338 | 483 | + | COG3335 | Transposase | Transposase |
| 18 | GC_00000010 | CelG3 | 5 | 5 | 7 | 5 | 6 | Pip:1245 | 1317 | 45 | ... | 341 | [1317, 1325, 1439, 1493, 0, 1175] | [contig_22, contig_2, contig_10, contig_1] | 40730 | 41755 | 1026 | + | COG1317 | Transposase | Flagellar biosynthesis/type III secretory path... |
| 55 | GC_00000145 | CelG3 | 1 | 1 | 1 | 1 | 1 | Pip:5 | 1431 | 59 | ... | 98 | [1431] | [contig_22] | 69792 | 70148 | 357 | + | COG3293 | Transposase | Transposase |
| 71 | GC_00000131 | CelG3 | 1 | 1 | 1 | 1 | 1 | Pip:5 | 1429 | 58 | ... | 162 | [1429] | [contig_22] | 69356 | 69688 | 333 | + | COG3293 | Transposase | Transposase |
| 78 | GC_00001077 | CelG3 | 1 | 1 | 1 | 0 | 1 | Pip:1 | 1370 | 25 | ... | 450 | [1370] | [contig_15] | 21390 | 22781 | 1392 | - | COG4467 | Transposase | Regulator of replication initiation timing Yab... |
| 111 | GC_00000112 | CelG3 | 1 | 1 | 1 | 1 | 1 | Pip:1 | 1320 | 48 | ... | 172 | [1320] | [contig_10] | 47490 | 48008 | 519 | + | COG3335 | Transposase | Transposase |
| 113 | GC_00000120 | CelG3 | 1 | 1 | 1 | 1 | 1 | Pip:1 | 1321 | 49 | ... | 136 | [1321] | [contig_10] | 48082 | 48492 | 411 | + | COG3335 | Transposase | Transposase |
11 rows × 31 columns
# Show all gene clusters annotated as 'Replication/repair'.
merged_df.loc[merged_df['Name'] == 'Replication/repair']
| gene_cluster_id | genome_name | nb_copies_in_WO_description | nb_copies_in_PipPel | nb_copies_in_JHB | nb_copies_in_PipMol | nb_copies_in_CelG3 | WOPip_number_sequence | CelG3_id | WOseq_id | ... | aa_length | all_call_ids | contigs | start | stop | wo_length | orientation | COG | Name | Product | |
|---|---|---|---|---|---|---|---|---|---|---|---|---|---|---|---|---|---|---|---|---|---|
| 30 | GC_00000026 | CelG3 | 3 | 3 | 6 | 4 | 3 | Pip:145 | 1406 | 30 | ... | 268 | [1406, 1201, 1449] | [contig_22, contig_3, contig_14] | 26999 | 27805 | 807 | + | COG0358 | Replication/repair | DNA primase (bacterial type) (DnaG) (PDB:3B39)... |
| 47 | GC_00000091 | CelG3 | 2 | 2 | 0 | 1 | 1 | Pip:12 | 1451 | 28 | ... | 164 | [1451] | [contig_14] | 25606 | 26100 | 495 | + | COG1595 | Replication/repair | DNA-directed RNA polymerase specialized sigma ... |
| 50 | GC_00000031 | CelG3 | 4 | 4 | 4 | 3 | 3 | Pip:12 | 1452 | 3 | ... | 753 | [1452, 1503, 1369] | [contig_16, contig_14, contig_15] | 1586 | 3391 | 1806 | + | COG0358 | Replication/repair | DNA primase (bacterial type) (DnaG) (PDB:3B39)... |
| 60 | GC_00000055 | CelG3 | 1 | 1 | 7 | 1 | 1 | Pip:5 | 1404 | 34 | ... | 485 | [1404] | [contig_22] | 47647 | 49395 | 1749 | - | COG0358 | Replication/repair | DNA primase (bacterial type) (DnaG) (PDB:3B39)... |
| 62 | GC_00000122 | CelG3 | 1 | 1 | 1 | 1 | 1 | Pip:5 | 1408 | 38 | ... | 174 | [1408] | [contig_22] | 51686 | 52210 | 525 | - | NaN | Replication/repair | NaN |
| 65 | GC_00000077 | CelG3 | 1 | 1 | 3 | 1 | 1 | Pip:5 | 1410 | 40 | ... | 704 | [1410] | [contig_22] | 53564 | 55678 | 2115 | - | COG0358 | Replication/repair | DNA primase (bacterial type) (DnaG) (PDB:3B39)... |
| 66 | GC_00000029 | CelG3 | 4 | 3 | 5 | 3 | 3 | Pip:1245 | 1407 | 37 | ... | 274 | [1202, 1450, 1407] | [contig_22, contig_3, contig_14] | 50801 | 51625 | 825 | - | NaN | Replication/repair | NaN |
| 81 | GC_00000173 | CelG3 | 1 | 1 | 1 | 1 | 1 | Pip:1 | 1371 | 24 | ... | 472 | [1371] | [contig_15] | 19517 | 20935 | 1419 | - | COG1672 | Replication/repair | Predicted ATPase, archaeal AAA+ ATPase superfa... |
| 92 | GC_00000092 | CelG3 | 1 | 1 | 1 | 2 | 1 | Pip:4 | 1204 | 27 | ... | 685 | [1204] | [contig_3] | 34454 | 36511 | 2058 | + | COG0358 | Replication/repair | DNA primase (bacterial type) (DnaG) (PDB:3B39)... |
| 102 | GC_00000117 | CelG3 | 1 | 1 | 1 | 1 | 1 | Pip:4 | 1203 | 28 | ... | 166 | [1203] | [contig_3] | 36546 | 37046 | 501 | + | NaN | Replication/repair | NaN |
10 rows × 31 columns
# Create a new column 'rowname' combining COG, wo_name, and WOseq_id+1 for unique identification.
merged_df['rowname'] = merged_df['COG'].astype(str) + '_' + merged_df['wo_name'] + ':' + (merged_df['WOseq_id']+1).astype(str)
# Show selected columns for gene clusters annotated as 'Transposase'.
merged_df.loc[merged_df['Name'] == 'Transposase'][['gene_cluster_id', 'COG20_FUNCTION', 'wo_length', 'rowname']]
| gene_cluster_id | COG20_FUNCTION | wo_length | rowname | |
|---|---|---|---|---|
| 0 | GC_00000001 | Transposase | 873 | COG3293_WOPip1:1 |
| 1 | GC_00000002 | Transposase (or an inactivated derivative) (IS... | 669 | COG3328_WOPip1:54 |
| 2 | GC_00000019 | Transposase | 948 | COG3547_WOPip4:35 |
| 3 | GC_00000007 | Transposase (or an inactivated derivative), DD... | 423 | COG3316_WOPip5:2 |
| 5 | GC_00000003 | Transposase|CRISPR-associated protein Csa3, CA... | 483 | COG3335_WOPip1:34 |
| 18 | GC_00000010 | Flagellar biosynthesis/type III secretory path... | 1026 | COG1317_WOPip1:46 |
| 55 | GC_00000145 | Transposase | 357 | COG3293_WOPip5:60 |
| 71 | GC_00000131 | Transposase | 333 | COG3293_WOPip5:59 |
| 78 | GC_00001077 | Regulator of replication initiation timing Yab... | 1392 | COG4467_WOPip1:26 |
| 111 | GC_00000112 | Transposase|CRISPR-associated protein Csa3, CA... | 519 | COG3335_WOPip1:49 |
| 113 | GC_00000120 | Transposase|CRISPR-associated protein Csa3, CA... | 411 | COG3335_WOPip1:50 |
# Show selected columns for gene clusters annotated as 'Replication/repair'.
merged_df.loc[merged_df['Name'] == 'Replication/repair'][['gene_cluster_id', 'COG20_FUNCTION', 'wo_length', 'rowname']]
| gene_cluster_id | COG20_FUNCTION | wo_length | rowname | |
|---|---|---|---|---|
| 30 | GC_00000026 | DNA primase (bacterial type) (DnaG) (PDB:3B39)... | 807 | COG0358_WOPip1:31 |
| 47 | GC_00000091 | DNA-directed RNA polymerase specialized sigma ... | 495 | COG1595_WOPip1:29 |
| 50 | GC_00000031 | DNA primase (bacterial type) (DnaG) (PDB:3B39)... | 1806 | COG0358_WOPip2:4 |
| 60 | GC_00000055 | DNA primase (bacterial type) (DnaG) (PDB:3B39)... | 1749 | COG0358_WOPip5:35 |
| 62 | GC_00000122 | DNA-directed RNA polymerase specialized sigma ... | 525 | nan_WOPip5:39 |
| 65 | GC_00000077 | DNA primase (bacterial type) (DnaG) (PDB:3B39)... | 2115 | COG0358_WOPip5:41 |
| 66 | GC_00000029 | NaN | 825 | nan_WOPip5:38 |
| 81 | GC_00000173 | Predicted ATPase, archaeal AAA+ ATPase superfa... | 1419 | COG1672_WOPip1:25 |
| 92 | GC_00000092 | DNA primase (bacterial type) (DnaG) (PDB:3B39)... | 2058 | COG0358_WOPip4:28 |
| 102 | GC_00000117 | DNA-directed RNA polymerase specialized sigma ... | 501 | nan_WOPip4:29 |
# Show selected columns for gene clusters annotated as 'Transcriptional regulator'.
merged_df.loc[merged_df['Name'] == 'Transcriptional regulator'][['gene_cluster_id', 'COG20_FUNCTION', 'wo_length', 'rowname']]
| gene_cluster_id | COG20_FUNCTION | wo_length | rowname | |
|---|---|---|---|---|
| 29 | GC_00000012 | Transcriptional regulator, contains XRE-family... | 978 | COG1396_WOPip4:53 |
| 36 | GC_00000121 | Transcriptional regulator, contains XRE-family... | 915 | COG1396_WOPip1:39 |
| 42 | GC_00000180 | Transcriptional regulator, contains XRE-family... | 840 | COG1396_WOPip1:38 |
| 52 | GC_00000024 | Transcriptional regulator, contains XRE-family... | 921 | COG1396_WOPip1:42 |
# Print gene_cluster_id for all clusters annotated as 'ANKYR', one per line.
print('\n'.join([str(x[0]) for x in merged_df.loc[merged_df['Name'] == 'ANKYR'][['gene_cluster_id']].values.tolist()]))
GC_00000043
GC_00000057
GC_00000045
GC_00000053
GC_00000095
GC_00000063
GC_00000099
GC_00000052
GC_00000041
GC_00000130
GC_00000192
# Show selected columns for gene clusters annotated as 'Connector/baseplate'.
merged_df.loc[merged_df['Name'] == 'Connector/baseplate'][['gene_cluster_id', 'COG20_FUNCTION', 'wo_length', 'rowname']]
| gene_cluster_id | COG20_FUNCTION | wo_length | rowname | |
|---|---|---|---|---|
| 7 | GC_00000020 | NaN | 498 | nan_WOPip1:12 |
| 10 | GC_00000016 | Phage P2 baseplate assembly protein gpV (gpV) ... | 465 | COG4540_WOPip1:10 |
| 13 | GC_00000017 | Zn-binding Pro-Ala-Ala-Arg (PAAR) domain, invo... | 255 | COG4104_WOPip1:9 |
| 14 | GC_00000034 | NaN | 306 | nan_WOPip1:13 |
| 16 | GC_00000028 | Phage-related baseplate assembly protein (PDB:... | 792 | COG3948_WOPip1:7 |
| 20 | GC_00000018 | NaN | 477 | nan_WOPip1:11 |
| 24 | GC_00000033 | Phage baseplate assembly protein W (PDB:2IA7) | 336 | COG3628_WOPip1:8 |
| 41 | GC_00000013 | Bacteriophage P2-related tail formation protei... | 1161 | COG4385_WOPip2:23 |
# Show selected columns for gene clusters annotated as 'ANKYR'.
merged_df.loc[merged_df['Name'] == 'ANKYR'][['gene_cluster_id', 'COG20_FUNCTION', 'wo_length', 'rowname']]
| gene_cluster_id | COG20_FUNCTION | wo_length | rowname | |
|---|---|---|---|---|
| 21 | GC_00000043 | Ankyrin repeat (ANKYR) (PDB:6AUN) | 1473 | COG0666_WOPip1:20 |
| 28 | GC_00000057 | Ankyrin repeat (ANKYR) (PDB:6AUN) | 1194 | COG0666_WOPip1:40 |
| 48 | GC_00000045 | Ankyrin repeat (ANKYR) (PDB:6AUN) | 813 | COG0666_WOPip3:17 |
| 53 | GC_00000053 | Ankyrin repeat (ANKYR) (PDB:6AUN) | 450 | COG0666_WOPip2:25 |
| 59 | GC_00000095 | Ankyrin repeat (ANKYR) (PDB:6AUN) | 1983 | COG0666_WOPip5:61 |
| 68 | GC_00000063 | Ankyrin repeat (ANKYR) (PDB:6AUN) | 1242 | COG0666_WOPip4:54 |
| 80 | GC_00000099 | Tetratricopeptide (TPR) repeat (TPR) (PDB:3AS4... | 7863 | COG0457_WOPip4:3 |
| 88 | GC_00000052 | NaN | 8247 | COG0666_WOPip2:32 |
| 91 | GC_00000041 | NaN | 525 | COG0666_WOPip4:48 |
| 97 | GC_00000130 | Ankyrin repeat (ANKYR) (PDB:6AUN) | 1947 | COG0666_WOPip2:28 |
| 112 | GC_00000192 | Ankyrin repeat (ANKYR) (PDB:6AUN) | 474 | COG0666_WOPip3:18 |
# Show all rows in df_interest for gene cluster 'GC_00000020'.
df_interest.loc[df_interest['gene_cluster_id'] == 'GC_00000020']
| gene_cluster_id | bin_name | genome_name | gene_callers_id | num_genomes_gene_cluster_has_hits | num_genes_in_gene_cluster | max_num_paralogs | SCG | functional_homogeneity_index | geometric_homogeneity_index | combined_homogeneity_index | COG20_FUNCTION_ACC | COG20_FUNCTION | COG20_CATEGORY_ACC | COG20_CATEGORY | aa_sequence | length | |
|---|---|---|---|---|---|---|---|---|---|---|---|---|---|---|---|---|---|
| unique_id | |||||||||||||||||
| 807 | GC_00000020 | WO | CelG3 | 1188 | 9 | 21 | 5 | 0 | 0.880854 | 0.881253 | 0.881054 | NaN | NaN | NaN | NaN | ------------------------MRALNRTALWLKSKAAKKISEE... | 141 |
| 808 | GC_00000020 | WO | CelG3 | 1216 | 9 | 21 | 5 | 0 | 0.880854 | 0.881253 | 0.881054 | NaN | NaN | NaN | NaN | ------------------------MRALNRTALWLKSKAAKKISEE... | 141 |
| 809 | GC_00000020 | WO | CelG3 | 1465 | 9 | 21 | 5 | 0 | 0.880854 | 0.881253 | 0.881054 | NaN | NaN | NaN | NaN | ------------------------MRALNRTALWLKSKAAKKISEE... | 141 |
| 810 | GC_00000020 | WO | CelG3 | 1424 | 9 | 21 | 5 | 0 | 0.880854 | 0.881253 | 0.881054 | NaN | NaN | NaN | NaN | ------------------------MRALNRTALWLKLKTAKEISEE... | 139 |
| 811 | GC_00000020 | WO | PipJHB | 99 | 9 | 21 | 5 | 0 | 0.880854 | 0.881253 | 0.881054 | NaN | NaN | NaN | NaN | MSVHIEVEVIESANAKRKKIELAIVRALNRTALWLKSKAAKKISEE... | 165 |
| 812 | GC_00000020 | WO | PipJHB | 1330 | 9 | 21 | 5 | 0 | 0.880854 | 0.881253 | 0.881054 | NaN | NaN | NaN | NaN | MSVHIEVEVIESANAKRKKIELAIVRALNRTALWLKSKAAKKISEE... | 165 |
| 813 | GC_00000020 | WO | PipJHB | 1489 | 9 | 21 | 5 | 0 | 0.880854 | 0.881253 | 0.881054 | NaN | NaN | NaN | NaN | MSVHIEVEVIENVNAKRKKIELAIVRALNRTALWLKLKTAKEISEE... | 163 |
| 814 | GC_00000020 | WO | PipJHB | 1416 | 9 | 21 | 5 | 0 | 0.880854 | 0.881253 | 0.881054 | NaN | NaN | NaN | NaN | -MFHNVNQVISDIRGKEAQIKLVVAKALNKTAIWLKGQAAKEISEE... | 165 |
| 815 | GC_00000020 | WO | PipJHB | 1502 | 9 | 21 | 5 | 0 | 0.880854 | 0.881253 | 0.881054 | NaN | NaN | NaN | NaN | ----------------------------------------------... | 48 |
| 816 | GC_00000020 | WO | PipMol | 1125 | 9 | 21 | 5 | 0 | 0.880854 | 0.881253 | 0.881054 | NaN | NaN | NaN | NaN | MSVHIEVEVIENVNAKRKKIELAIVRALNRTALWLKLKTAKEISEE... | 163 |
| 817 | GC_00000020 | WO | PipMol | 1207 | 9 | 21 | 5 | 0 | 0.880854 | 0.881253 | 0.881054 | NaN | NaN | NaN | NaN | -MFHNVNQVISDIRGKEAQIKLVVAKALNKTAIWLKGQAAKEISEE... | 152 |
| 818 | GC_00000020 | WO | PipPel | 253 | 9 | 21 | 5 | 0 | 0.880854 | 0.881253 | 0.881054 | NaN | NaN | NaN | NaN | MSVHIEVEVIESANAKRKKIELAIVRALNRTALWLKSKAAKKISEE... | 165 |
| 819 | GC_00000020 | WO | PipPel | 336 | 9 | 21 | 5 | 0 | 0.880854 | 0.881253 | 0.881054 | NaN | NaN | NaN | NaN | MSVHIEVEVIESANAKRKKIELAIVRALNRTALWLKSKAAKKISEE... | 165 |
| 820 | GC_00000020 | WO | PipPel | 423 | 9 | 21 | 5 | 0 | 0.880854 | 0.881253 | 0.881054 | NaN | NaN | NaN | NaN | MSVHIEVEVIESVNAKRKKIELAIVRALNKTALWLKAQAAKEISEE... | 163 |
| 821 | GC_00000020 | WO | PipPel | 1314 | 9 | 21 | 5 | 0 | 0.880854 | 0.881253 | 0.881054 | NaN | NaN | NaN | NaN | MSVHIEVEVIENVNAKRKKIELAIVRALNRTALWLKLKTAKEISEE... | 163 |
| 822 | GC_00000020 | WO | PipPel | 313 | 9 | 21 | 5 | 0 | 0.880854 | 0.881253 | 0.881054 | NaN | NaN | NaN | NaN | -MFHNVNQVISDIRGKEAQIKLVVAKALNKTAIWLKGQAAKEISEE... | 165 |
| 823 | GC_00000020 | WO | WOPip1 | 11 | 9 | 21 | 5 | 0 | 0.880854 | 0.881253 | 0.881054 | NaN | NaN | NaN | NaN | MSVHIEVEVIESANAKRKKIELAIVRALNRTALWLKSKAAKKISEE... | 165 |
| 824 | GC_00000020 | WO | WOPip2 | 16 | 9 | 21 | 5 | 0 | 0.880854 | 0.881253 | 0.881054 | NaN | NaN | NaN | NaN | -MFHNVNQVISDIRGKEAQIKLVVAKALNKTAIWLKGQAAKEISEE... | 165 |
| 825 | GC_00000020 | WO | WOPip3 | 7 | 9 | 21 | 5 | 0 | 0.880854 | 0.881253 | 0.881054 | NaN | NaN | NaN | NaN | MSVHIEVEVIESANAKRKKIELAIVRALNRTALWLKSKAAKKISEE... | 165 |
| 826 | GC_00000020 | WO | WOPip4 | 15 | 9 | 21 | 5 | 0 | 0.880854 | 0.881253 | 0.881054 | NaN | NaN | NaN | NaN | MSVHIEVEVIESVNAKRKKIELAIVRALNKTALWLKAQAAKEISEE... | 163 |
| 827 | GC_00000020 | WO | WOPip5 | 53 | 9 | 21 | 5 | 0 | 0.880854 | 0.881253 | 0.881054 | NaN | NaN | NaN | NaN | MSVHIEVEVIENVNAKRKKIELAIVRALNRTALWLKLKTAKEISEE... | 163 |
# Show gene clusters with specific rownames (nan_WOPip1:15 and nan_WOPip1:14).
merged_df.loc[merged_df['rowname'].isin(['nan_WOPip1:15', 'nan_WOPip1:14'])]
| gene_cluster_id | genome_name | nb_copies_in_WO_description | nb_copies_in_PipPel | nb_copies_in_JHB | nb_copies_in_PipMol | nb_copies_in_CelG3 | WOPip_number_sequence | CelG3_id | WOseq_id | ... | all_call_ids | contigs | start | stop | wo_length | orientation | COG | Name | Product | rowname | |
|---|---|---|---|---|---|---|---|---|---|---|---|---|---|---|---|---|---|---|---|---|---|
| 9 | GC_00000023 | CelG3 | 5 | 5 | 4 | 2 | 4 | Pip:12345 | 1186 | 13 | ... | [1186, 1463, 1213, 1421] | [contig_22, contig_23, contig_14, contig_3] | 8120 | 9124 | 1005 | - | NaN | Head | NaN | nan_WOPip1:14 |
| 12 | GC_00000015 | CelG3 | 5 | 5 | 3 | 4 | 6 | Pip:12345 | 1185 | 14 | ... | [1185, 1462, 1212, 1420, 1474, 1505] | [contig_22, contig_23, contig_19, contig_14, c... | 9150 | 9521 | 372 | - | NaN | Head | NaN | nan_WOPip1:15 |
2 rows × 32 columns
# Set the 'Name' column to 'Toxins_pathogenicity' for rowname 'nan_WOPip5:24'.
merged_df.loc[merged_df['rowname'] == 'nan_WOPip5:24', 'Name'] = 'Toxins_pathogenicity'
# Set the 'Name' column to 'Toxins_pathogenicity' for rowname 'COG2026_WOPip5:23'.
merged_df.loc[merged_df['rowname'] == 'COG2026_WOPip5:23', 'Name'] = 'Toxins_pathogenicity'
# Build a dictionary mapping rownames to more readable labels for plotting.
dictio = {k: k.replace('_', '\n').replace('nan\n', '') for k in merged_df['rowname'].values}
Adding Custom Labels Adapted for Visualization
# Add custom labels to dictio for specific gene clusters (tail, head, transposase, etc.).
dictio['COG3500_WOPip5:18'] = 'gpD/late control\nTail Protein 7'
dictio['COG3497_WOPip4:41'] = 'Tail sheath protein\nTail Protein 1'
dictio['COG3499_WOPip4:45'] = 'gpUX tail assembly\nTail Protein 5-6'
dictio['COG3498_WOPip4:42'] = 'Tail tube protein\nTail Protein 2'
dictio['nan_WOPip5:22'] = 'gpG/gpGT chaperone\nTail Protein 3'
dictio['COG5283_WOPip5:21'] = 'Tail tape measure protein\nTail Protein 4'
# Toxins pathogeneicity
dictio['COG2026_WOPip5:23'] = 'Putative RelE-like\nWOPip5 Tail'
dictio['nan_WOPip5:24'] = 'Putative RelB-like\nWOPip5 Tail'
dictio['nan_WOPip5:5'] = 'Tox-SGS domain\nWOPip5 EAM'
dictio['nan_WOPip5:6'] = 'Putative RelB-like\nWOPip5 EAM'
dictio['COG3209_WOPip5:8'] = 'RhaS 28 repeats\nWOPip5 EAM'
# Tail fiber
dictio['nan_WOPip4:33'] = 'GP105\nTail Fiber 1'
dictio['nan_WOPip5:31'] = 'DUF4815\nTail Fiber 2'
dictio['nan_WOPip4:37'] = 'Lectin-like\nTail Fiber 3'
dictio['nan_WOPip4:38'] = 'DUF2730\nTail Fiber 4'
dictio['nan_WOPip4:39'] = 'Factor H-bind\nTail Fiber 5'
dictio['nan_WOPip4:40'] = 'Tail fiber assembly\nTail Fiber 6'
# Head
dictio['COG5525_WOPip1:19'] = 'gpA terminase\nHead Protein 1'
dictio['nan_WOPip1:18'] = 'gpW assembly protein\nHead Protein 2'
dictio['COG5511_WOPip1:17'] = 'Portal/Phage capsid protein\nHead Protein 3 ver. WOPip1'
dictio['COG5511_WOPip4:22'] = 'Portal/Phage capsid protein\nHead Protein 3 ver. WOPip4'
dictio['COG0616_WOPip4:21'] = 'ClpP/Minor capsid protein\n Head Protein 4'
dictio['nan_WOPip1:15'] = 'Head decoration protein D\n Head Protein 5'
dictio['nan_WOPip1:14'] = 'Major capsid protein\n Head Protein 6'
# Transposase
dictio['COG3335_WOPip1:34'] = 'IS630 DDE \nWOPip1 ver. 1' # GC03 # transposase HTH-DDE
dictio['COG3316_WOPip5:2'] = 'IS257/IS6 family\nWOPip1/5' # GC07 # transposase DDE
dictio['COG3293_WOPip1:1'] = 'IS982\nWOPip1/3/4/5' # GC01 # transposase DDE #  w/ integrase
dictio['COG3328_WOPip1:54'] = 'Mutator family\nWOPip1/3'# GC02 # transposase
dictio['COG3547_WOPip4:35'] = 'IS110\nWOPip4/5' # GC019 # transposase DEDD
dictio['COG3293_WOPip5:60'] = 'IS4/5-like DDE\nWOPip5 ver. 2' # GC0145 # transposase DDE
dictio['COG3293_WOPip5:59'] = 'IS4/5/IS407-like\nWOPip5 ver. 1' # GC0131 # transposase
dictio['COG3335_WOPip1:49'] = 'IS630 \nWOPip1 ver. 2' # GC0112 #  transposase HTH
dictio['COG3335_WOPip1:50'] = 'IS630 DDE\nWOPip1 ver. 3' # GC120 # transposase HTH-DDE
# Rep/Rep
dictio['COG0358_WOPip1:31'] = "RepA Helicase\nWOPip1/4/5" # 'RepA family Helicase\nWOPip145'
dictio['COG0358_WOPip2:4'] = "DnaG and NTPase\nWOPip12" #'DnaG Primase-NTPase-Helicase\nWOPip12'
dictio['COG1595_WOPip1:29'] = "Sigma-70 RNA Pol\nWOPip1/2" #'Sigma-70 R2 family RNA polymerase\nWOPip12'
dictio['nan_WOPip5:39'] = "Sigma-70 RNA Pol\nWOPip5" # 'Sigma-70 R2 family RNA polymerase\nWOPip5:39'
dictio['COG0358_WOPip5:35'] = "DnaG and NTPase\nWOPip5 ver. 1" # 'DnaG Primase-NTPase-Helicase\nWOPip5:35'
dictio['COG0358_WOPip5:41'] = "DnaG and NTPase\nWOPip5 ver. 2" #'DnaG Primase-NTPase\nWOPip5:41'
dictio['nan_WOPip5:38'] = 'Membrane ATP-bind\nWOPip1/2/4/5' # 'MCP tsmembrane ATP-binding protein\nWOPip1245'
dictio['nan_WOPip4:29'] = "Sigma-70 RNA Pol\nWOPip4" #'Sigma-70 R4 family RNA polymerase \nArp2/3 complex protein RickA\nWOPip4:28'
dictio['COG0358_WOPip4:28'] = "DnaG and NTPase\nWOPip4" # 'DnaG Primase-NTPase-Helicase\nWOPip4:29'
# Transreg
dictio['COG1396_WOPip1:42'] = 'XRE-HTH/$\lambda$ repressor\nWOPip1' # GC24
dictio['COG1396_WOPip1:39'] = 'XRE-HTH/$\lambda$ repressor\nWOPip1' # GC121
dictio['COG1396_WOPip4:53'] = 'XRE-HTH/$\lambda$ repressor\nWOPip1/4/5' # GC12
dictio['COG1396_WOPip1:38'] = 'XRE-HTH/$\lambda$ repressor\nWOPip1' # GC180
# Ankyrins
dictio['COG0666_WOPip1:20'] = "Head operon ankyrin\nWOPip1/2/5"# 'Head operon start ankyrin\nWOPip125' # GC_00000043
dictio['COG0666_WOPip1:40'] = "Ankyrin repeat\nWOPip1" # 'Ankyrin HTH and IS associated\nWOPip1' # GC_00000057
dictio['COG0666_WOPip3:17'] = 'Ubiquitin tsferase\nWOPip2/3/4'# GC_00000045
dictio['COG0666_WOPip2:25'] = 'Ankyrin repeat\nWOPip2/4' # GC_00000053
dictio['COG0666_WOPip5:61'] = 'Ankyrin repeat\nWOPip5' #  OTU-associated # GC_00000095
dictio['COG0666_WOPip4:54'] = 'Ankyrin repeat\nWOPip4/5' # HTH and IS associated# GC_00000063
dictio['COG0666_WOPip2:28'] = 'Ankyrin repeat\nWOPip2' #  OTU-associated  # GC_00000130
dictio['COG0666_WOPip4:48'] = 'Ankyrin repeat\nWOPip3/4' #GC_00000041
dictio['COG0666_WOPip2:32'] = 'Latrotoxin-related$~$ \nWOPip2' #GC_00000052 # -related
dictio['COG0666_WOPip3:18'] = '$\;$Phospholipase\nWOPip3' #GC_00000192
# Connector/baseplate
dictio['nan_WOPip1:12'] = "gpZ tail protein\n Connector 2" # GC_00000020
dictio['COG4540_WOPip1:10'] = "gpV \n Connector 4" # GC_00000016
dictio['COG4104_WOPip1:9'] = "PAAR \n Connector 5" # GC_00000017
dictio['nan_WOPip1:13'] = "gpFII \n Connector 1"  # GC_00000034
dictio['COG3948_WOPip1:7'] = "gpJ \n Connector 7" # GC_00000028
dictio['nan_WOPip1:11'] = "Collar \n Connector 3" # GC_00000018
dictio['COG3628_WOPip1:8'] = "gpW \n Connector 6" # GC_00000033
dictio['COG4385_WOPip2:23'] = "gpI \n Connector 8"  # GC_00000013
dictio['nan_WOPip2:16'] =  "gpZ tail protein\n WOPip2-only"# GC_00000991
dictio['COG5004_WOPip4:46'] = 'gpX tail assembly\nTail Protein 6'
# Add more custom labels to dictio for other gene clusters (functions, domains, etc.).
dictio['COG4804_WOPip5:58'] = 'DUF1016 N-terminal domain\nWOPip5'
dictio['COG4804_WOPip5:48'] = 'Nuclease superfamily\nWOPip5'
dictio['nan_WOPip2:29'] = 'cinB\nWOPip2'
dictio['nan_WOPip2:30'] = 'cinA\nWOPip2'
dictio['COG3344_WOPip3:16'] = 'YkfC/intron revtranscriptase\nWOPip3'
dictio['COG3344_WOPip1:45'] = 'YkfC/intron revtranscriptase\nWOPip1'
dictio['nan_WOPip5:33'] = 'WO-PC1-A\nWOPip5'
dictio['nan_WOPip5:34'] = 'WO-PC1-B\nWOPip5'
dictio['COG1714_WOPip4:4'] = 'RDD family protein\nWOPip5'
dictio['COG0484_WOPip5:3'] = 'DnaJ chaperone\nWOPip5'
dictio['COG3617_WOPip1:24'] = 'BRO family protein\nWOPip1'
dictio['COG0328_WOPip1:44'] = 'RNase H\nWOPip1'
dictio[':_WOPip1:36'] = 'Phosphatidylserin\nWOPip1/4/5'
dictio['COG0553_WOPip2:5'] = 'SNF2 family helicase\nWOPip2'
dictio['COG3943_WOPip4:26'] = 'Virulence RhuM family\nWOPip4'
dictio['COG4467_WOPip1:26'] = 'IS66 family\nWOPip1'
# Add even more custom labels to dictio for additional gene clusters.
dictio['COG1961_WOPip4:6'] = 'sr3WO\nWOPip2/3/4'
dictio['COG2814_WOPip4:62'] = 'Arabinose transporter\nWOPip4'
dictio['COG0456_WOPip4:61'] = 'Acetyltransferase\nWOPip4'
dictio['COG2764_WOPip4:18'] = 'Glyoxalase\nWOPip4'
dictio['COG1672_WOPip1:25'] = 'ATPase\nWOPip1'
dictio['nan_WOPip1:48'] = 'cidB\nWOPip1'
dictio['COG2003_WOPip4:55'] = 'RadC dsDNA rep.\nWOPip1/4/5'
dictio['COG0457_WOPip4:3'] = 'TPR repeat\nWOPip4'
dictio['COG4942_WOPip3:24'] = 'EnvC and DnaJ domain\nWOPip3'
dictio['COG0323_WOPip1:43'] = 'MutL mismatch rep.\nWOPip1'
dictio['nan_WOPip5:63'] = 'cidB(trunc)\nWOPip5'
dictio['COG0863_WOPip1:22'] = 'DNA methylase\nWOPip1/2/4/5'
dictio['COG3621_WOPip4:51'] = 'Patatin phospholipase\nWOPip1/4/5'
dictio['nan_WOPip1:47'] = 'cidA\nWOPip1'

dictio['COG3415_WOPip1:33'] = 'CRISPR-like TE\nWOPip1'
dictio['COG1317_WOPip1:46'] = 'Rpn family\nWOPip1/2/4/5'
dictio['COG0817_WOPip1:23'] = 'RuvC dsDNA rep.\nWOPip1/2/4/5'
# Add a new column 'manually_named' to merged_df using dictio for readable labels.
merged_df['manually_named'] = merged_df['rowname'].apply(lambda x: dictio[x].replace('\n', ' - ') if x in dictio else None)
# Save merged_df to CSV, dropping columns 'COG', 'Product', and 'rowname'.
merged_df.drop(['COG', 'Product', 'rowname'], axis=1).to_csv('WO_phage_predicted_number_copies_complete.csv', index=None)
“WO_phage_predicted_number_copies_complete.csv”
6. Visualization of Gene Function Coverage and Copy Number
We use bar plots to compare coverage and copy number predictions across gene functions, highlighting both frequent and rare categories.
# Import matplotlib for plotting coverage by gene function.
import matplotlib.pyplot as plt

# Prepare DataFrame for plotting.
df = merged_df
df['Value'] = df['coverage_in_CelG3']
df['Copies'] = df['predicted_nb_copies_in_CelG3'].apply(lambda x: max(x, 1))

# Count occurrences of each value in the 'Name' column
name_counts = df['Name'].value_counts()

# Select the top 8 names by quantity
top_8_names = name_counts.head(8).index

# Filter the DataFrame to include only the top 8 names
filtered_df = df[df['Name'].isin(top_8_names)]

# Palette for the top names
palette = sns.color_palette("pastel", len(top_8_names))

# Create subplots for each gene function.
fig, axes = plt.subplots(nrows=4, ncols=1, figsize=(15, 9), sharex=False)
axes = axes.flatten()

# For each selected gene function, plot a bar chart of coverage per gene cluster.
i = 0
for ax, name in zip(axes, top_8_names):
    subset = filtered_df[filtered_df['Name'] == name]
    bars = ax.bar(subset['rowname'].astype(str), subset['Value'].to_numpy(), width=0.5, color=palette[i])
    ax.set_title(f'Name: {name}')
    ax.set_ylabel('CelG3 coverage')
    ax.set_xticks(subset['rowname'].astype(str))
    new_labels = [dictio[label] for label in subset['rowname'].astype(str)]
    ax.set_xticklabels(new_labels, rotation=0 if i >= 0 else 90)  # Set rotation to 0 for better readability
    # Annotate each bar with three numbers:
    # - nb_copies_in_PipPel (skyblue, right of bar)
    # - nb_copies_in_CelG3 (darkseagreen, center of bar)
    # - predicted_nb_copies_in_CelG3 (firebrick, left of bar)
    for bar, value2, value25, value3 in zip(bars, subset['Copies'].astype(int), subset['nb_copies_in_CelG3'].astype(int),
                                   subset['nb_copies_in_PipPel'].astype(int)):
        ax.text(bar.get_x() + bar.get_width() / 2 + 0.15 + (0.04 if i == 0 else 0), bar.get_height(), f'{value3:d}',
                ha='center', va='bottom', color='skyblue')
        ax.text(bar.get_x() + bar.get_width() / 2, bar.get_height(), f'{value25:d}',
                ha='center', va='bottom', color='darkseagreen')
        ax.text(bar.get_x() + bar.get_width() / 2 - 0.15 - (0.04 if i == 0 else 0), bar.get_height(), f'{value2:d}',
                ha='center', va='bottom', color='firebrick')
    # Annotate average predicted copy number for this function.
    average = subset['Copies'].mean()
    ax.annotate(f'Avg: {average:.2f}', xy=(0.95, 0.95), xycoords='axes fraction', color='firebrick',
                ha='right', va='top', fontsize=12, bbox=dict(boxstyle='round,pad=0.3', edgecolor='black', facecolor='wheat'))
    # Adjust y-axis limit to add space above the highest bar
    max_value = subset['Value'].max()
    ax.set_ylim(0, max_value * 1.2)  # Add 20% space above the highest value
    i += 1

# Add a custom legend entry for the annotations
fig.legend([plt.Line2D([0], [0], color='firebrick', lw=4)], ['Coverage prediction # copies in wPipCelG'],
           loc='lower left', bbox_to_anchor=(0.01, 1), frameon=False)

# Add a second custom legend entry at the top center
fig.legend([plt.Line2D([0], [0], color='darkseagreen', lw=4)], ['Reported # copies in wPipCelG'],
           loc='lower center', bbox_to_anchor=(0.505, 1), frameon=False)

# Add a third custom legend entry at the top left
fig.legend([plt.Line2D([0], [0], color='skyblue', lw=4)], ['Reported # copies in wPipPel'],
           loc='lower right', bbox_to_anchor=(1, 1), frameon=False)

# Adjust layout
plt.tight_layout()
plt.savefig('output_images/fig_a.pdf')
plt.show()
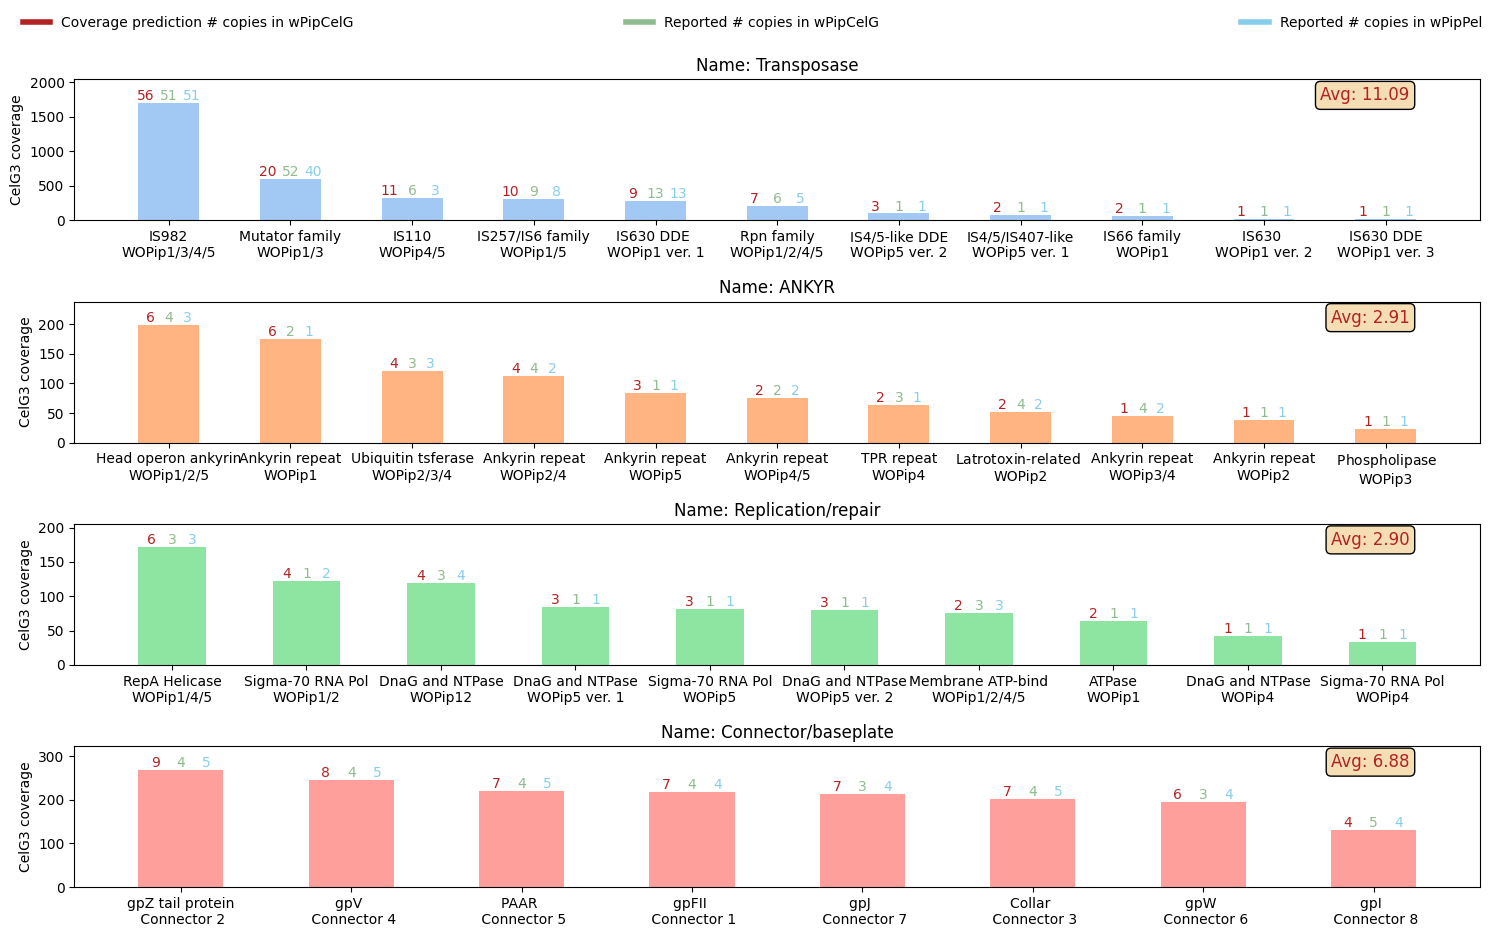
# This time, plot two columns for least frequent functions, create a GridSpec layout for multiple bar plots.
import matplotlib.pyplot as plt
import matplotlib.gridspec as gridspec

# Sample DataFrame
df = merged_df
df['Value'] = df['coverage_in_CelG3']
df['Copies'] = df['predicted_nb_copies_in_CelG3'].apply(lambda x: max(x, 1))

# Count occurrences of each value in the 'Name' column
name_counts = df['Name'].value_counts()

# Select the top 8 names by quantity
top_8_names = name_counts.head(9).tail(5).index

# Filter the DataFrame to include only the top 8 names
filtered_df = df[df['Name'].isin(top_8_names)]

palette = sns.color_palette("muted", 12)

# Create a figure
fig = plt.figure(figsize=(15, 9))

# Create a GridSpec with 4 rows and 2 columns
gs = gridspec.GridSpec(4, 2, height_ratios=[1, 1, 1, 1], width_ratios=[1, 1])

# Create subplots
ax1 = fig.add_subplot(gs[0, :])  # First row spans both columns
ax2 = fig.add_subplot(gs[1, :])  # Second row spans both columns
ax3 = fig.add_subplot(gs[2, :])  # Third row spans both columns
ax4 = fig.add_subplot(gs[3, 0])  # Fourth row, first column
ax5 = fig.add_subplot(gs[3, 1])  # Fourth row, second column

# List of axes
axes = [ax1, ax2, ax3, ax4, ax5]

# For each selected gene function, plot a bar chart of coverage per gene cluster.
i = 0
for ax, name in zip(axes, top_8_names):
    subset = filtered_df[filtered_df['Name'] == name]
    bars = ax.bar(subset['rowname'].astype(str), subset['Value'].to_numpy(), width=0.5, color=palette[i+6])
    ax.set_title(f'Name: {name}')
    #ax.set_xlabel('Index')
    ax.set_ylabel('CelG3 coverage')
    ax.set_xticks(subset['rowname'].astype(str))
    new_labels = [dictio[label] for label in subset['rowname'].astype(str)]
    ax.set_xticklabels(new_labels, rotation=0 if i >= 0 else 90)  # Set rotation to 0 for better readability
    # Annotate each bar with three numbers:
    # - nb_copies_in_PipPel (skyblue, right of bar)
    # - nb_copies_in_CelG3 (darkseagreen, center of bar)
    # - predicted_nb_copies_in_CelG3 (firebrick, left of bar)
    for bar, value2, value25, value3 in zip(bars, subset['Copies'].astype(int), subset['nb_copies_in_CelG3'].astype(int),
                                   subset['nb_copies_in_PipPel'].astype(int)):
        ax.text(bar.get_x() + bar.get_width() / 2 + 0.15 + (0.05 if i == 1 else 0), bar.get_height(), f'{value3:d}',
                ha='center', va='bottom', color='skyblue')
        ax.text(bar.get_x() + bar.get_width() / 2, bar.get_height(), f'{value25:d}',
                ha='center', va='bottom', color='darkseagreen')
        ax.text(bar.get_x() + bar.get_width() / 2 - 0.15 - (0.05 if i == 1 else 0), bar.get_height(), f'{value2:d}',
                ha='center', va='bottom', color='firebrick')
    # Annotate average predicted copy number for this function.
    average = subset['Copies'].mean()
    ax.annotate(f'Avg: {average:.2f}', xy=(0.95, 0.95), xycoords='axes fraction', color='firebrick',
                ha='right', va='top', fontsize=12, bbox=dict(boxstyle='round,pad=0.3', edgecolor='black', facecolor='wheat'))
    # Adjust y-axis limit to add space above the highest bar
    max_value = subset['Value'].max()
    ax.set_ylim(0, max_value *  1.2)  # Add 20% space above the highest value
    i += 1

# Add a custom legend entry for the annotations
fig.legend([plt.Line2D([0], [0], color='firebrick', lw=4)], ['Coverage prediction # copies in wPipCelG'],
           loc='lower left', bbox_to_anchor=(0.01, 1), frameon=False)

# Add a second custom legend entry at the top center
fig.legend([plt.Line2D([0], [0], color='darkseagreen', lw=4)], ['Reported # copies in wPipCelG'],
           loc='lower center', bbox_to_anchor=(0.505, 1), frameon=False)

# Add a third custom legend entry at the top left
fig.legend([plt.Line2D([0], [0], color='skyblue', lw=4)], ['Reported # copies in wPipPel'],
           loc='lower right', bbox_to_anchor=(1, 1), frameon=False)

# Adjust layout
plt.tight_layout()
plt.savefig('output_images/fig_b.pdf')
plt.show()
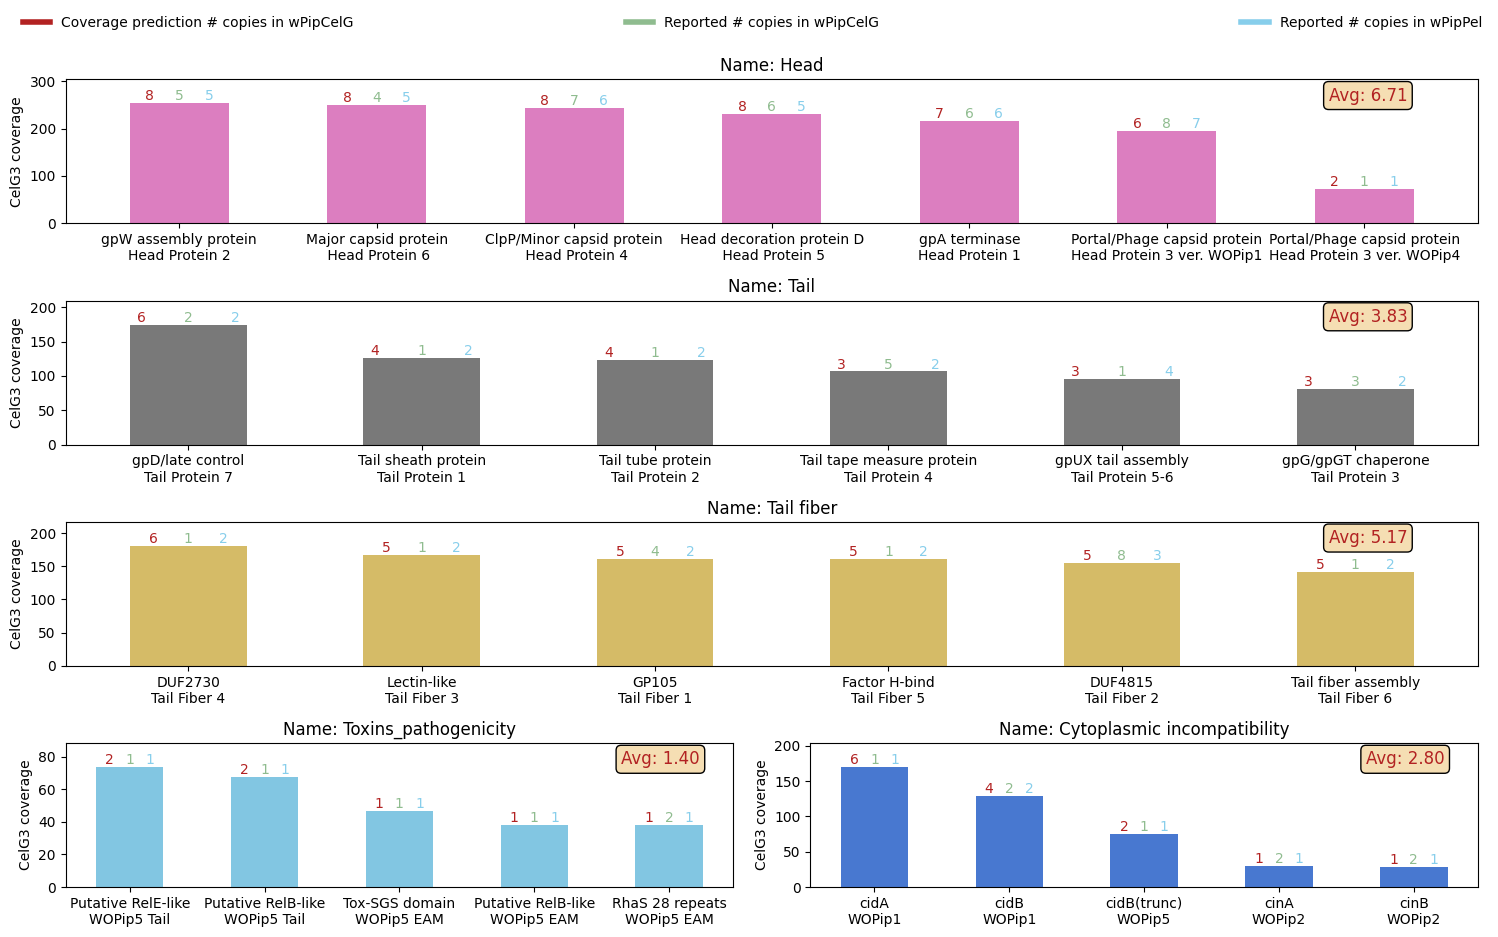
# Another bar plot: more subplots, showing coverage for the last 14 most frequent gene functions.
import matplotlib.pyplot as plt
import matplotlib.pyplot as plt
import matplotlib.gridspec as gridspec


# Sample DataFrame
df = merged_df
df['Value'] = df['coverage_in_CelG3']
df['Copies'] = df['predicted_nb_copies_in_CelG3'].apply(lambda x: max(x, 1))

# Count occurrences of each value in the 'Name' column
name_counts = df['Name'].value_counts()

# Select the top 8 names by quantity
top_8_names = name_counts.tail(14).index

# Filter the DataFrame to include only the top 8 names and initialize palette
filtered_df = df[df['Name'].isin(top_8_names)]
palette = sns.color_palette("muted", len(top_8_names))
all_subsets = []

# Create subplots
fig = plt.figure(figsize=(15, 9), constrained_layout=True)

# Create a GridSpec with 4 rows and 6 columns
gs = gridspec.GridSpec(4, 6, height_ratios=[1, 1, 1, 1], width_ratios=[1, 1, 1, 1, 1, 1])

# Create 14 subplots for the 14 gene functions.
axes = [
    fig.add_subplot(gs[0, :3]), fig.add_subplot(gs[0, 3:]),
    fig.add_subplot(gs[1, :2]), fig.add_subplot(gs[1, 2:4]), fig.add_subplot(gs[1, 4:]),
    fig.add_subplot(gs[2, :2]), fig.add_subplot(gs[2, 2:4]), fig.add_subplot(gs[2, 4:]),
    fig.add_subplot(gs[3, :1]), fig.add_subplot(gs[3, 1:2]), fig.add_subplot(gs[3, 2:3]),
    fig.add_subplot(gs[3, 3:4]), fig.add_subplot(gs[3, 4:5]), fig.add_subplot(gs[3, 5:6])
]

i=0
for ax, name in zip(axes, top_8_names):
    subset = filtered_df[filtered_df['Name'] == name]
    # Plot bars for each gene cluster in this function.
    bars = ax.bar(subset['rowname'].astype(str), subset['Value'].to_numpy(), width=0.5, color=palette[i])
    ax.set_title(f'Name: {name}')
    ax.set_ylabel('CelG3 coverage')
    ax.set_xticks(subset['rowname'].astype(str))
    new_labels = [dictio[label] for label in subset['rowname'].astype(str)]
    ax.set_xticklabels(new_labels, rotation=0 if i >= 0 else 90)  # Set rotation to 0 for better readability
    # Annotate each bar with three copy numbers (see previous cell for details).
    for bar, value2, value25, value3 in zip(bars, subset['Copies'].astype(int), subset['nb_copies_in_CelG3'].astype(int),
                                   subset['nb_copies_in_PipPel'].astype(int)):
        ax.text(bar.get_x() + bar.get_width() / 2 + 0.15 + (0.05 if i == 1 else 0), bar.get_height(), f'{value3:d}',
                ha='center', va='bottom', color='skyblue')
        ax.text(bar.get_x() + bar.get_width() / 2, bar.get_height(), f'{value25:d}',
                ha='center', va='bottom', color='darkseagreen')
        ax.text(bar.get_x() + bar.get_width() / 2 - 0.15 - (0.05 if i == 1 else 0), bar.get_height(), f'{value2:d}',
                ha='center', va='bottom', color='firebrick')

    # Annotate average predicted copy number only for first two functions.
    if i < 2:
        average = subset['Copies'].mean()
        ax.annotate(f'Avg: {average:.2f}', xy=(0.95, 0.95), xycoords='axes fraction', color='firebrick',
                    ha='right', va='top', fontsize=12, bbox=dict(boxstyle='round,pad=0.3', edgecolor='black', facecolor='wheat'))

    # Adjust y-axis limit to add space above the highest bar
    max_value = subset['Value'].max()
    if i not in [0, 2, 5, 8]: # Hide y-label
        ax.set_ylabel('')
    if i > 7: # Adjust xlim for barplots with only one function
        ax.set_xlim(-0.8, 0.8)
    ax.set_ylim(0, max_value * 1.2)  # Add 20% space above the highest value
    all_subsets.append(subset)
    i += 1

# Add a custom legend entry for the annotations
fig.legend([plt.Line2D([0], [0], color='firebrick', lw=4)], ['Coverage prediction # copies in wPipCelG'],
           loc='lower left', bbox_to_anchor=(0.01, 1), frameon=False)

# Add a second custom legend entry at the top center
fig.legend([plt.Line2D([0], [0], color='darkseagreen', lw=4)], ['Reported # copies in wPipCelG'],
           loc='lower center', bbox_to_anchor=(0.505, 1), frameon=False)

# Add a third custom legend entry at the top left
fig.legend([plt.Line2D([0], [0], color='skyblue', lw=4)], ['Reported # copies in wPipPel'],
           loc='lower right', bbox_to_anchor=(1, 1), frameon=False)

# Adjust layout
plt.tight_layout()
plt.savefig('output_images/fig_c.pdf')
plt.show()
/tmp/ipykernel_638449/540887075.py:87: UserWarning: This figure was using constrained_layout, but that is incompatible with subplots_adjust and/or tight_layout; disabling constrained_layout.
  plt.tight_layout()
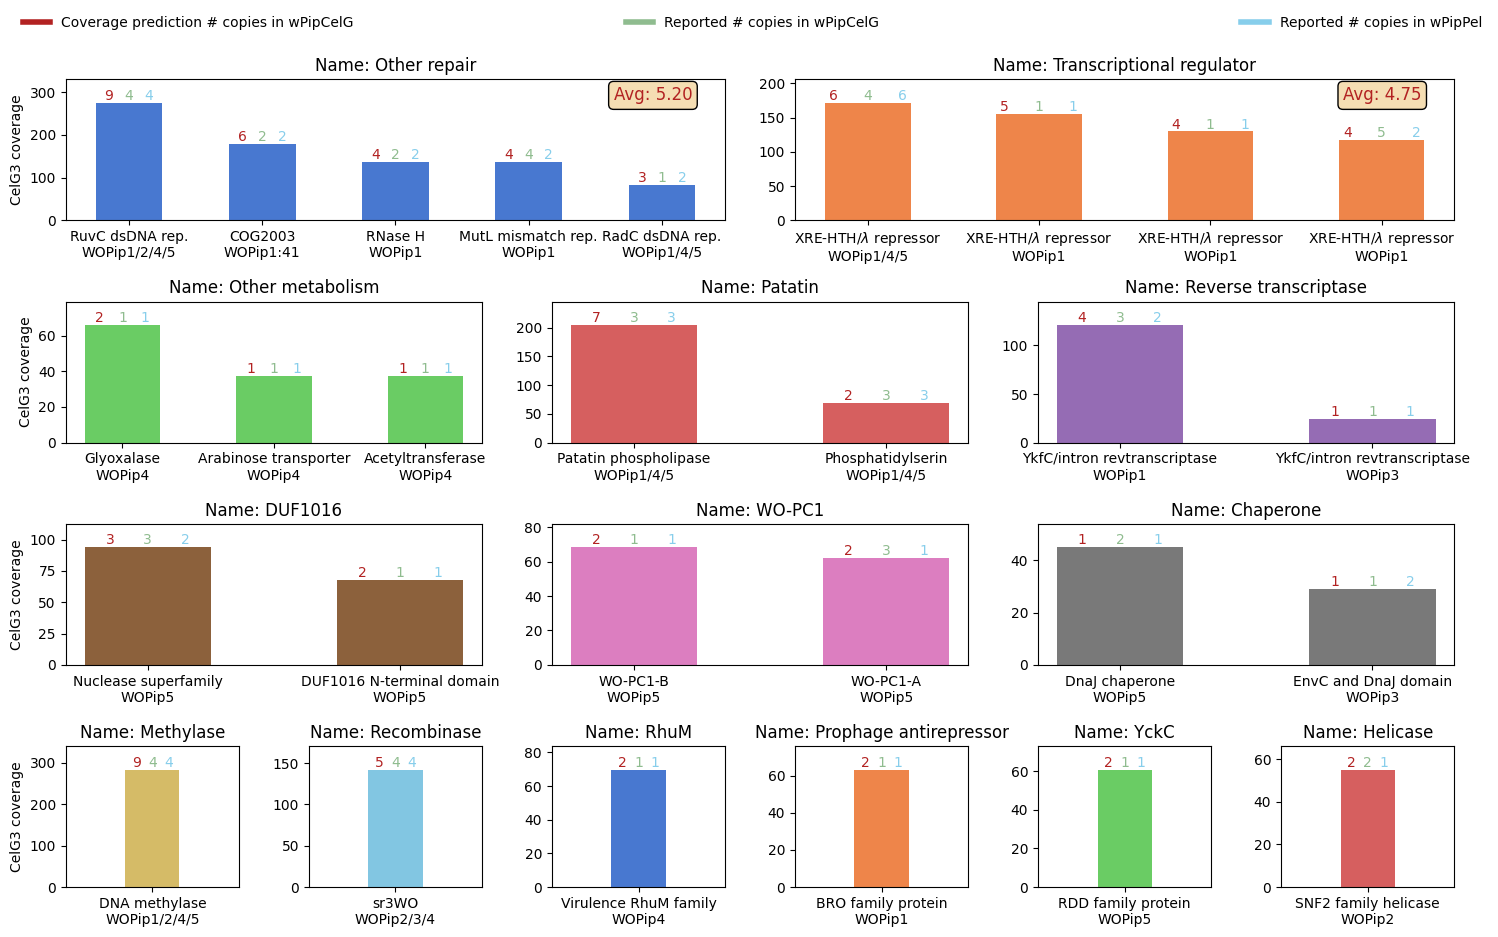
Summary of Gene Function Counts
# Display the counts of each gene function in the 'Name' column.
name_counts
Name
Transposase                    11
ANKYR                          11
Replication/repair             10
Connector/baseplate             8
Head                            7
Tail                            6
Tail fiber                      6
Toxins_pathogenicity            5
Cytoplasmic incompatibility     5
Other repair                    5
Transcriptional regulator       4
Other metabolism                3
Patatin                         2
Reverse transcriptase           2
DUF1016                         2
WO-PC1                          2
Chaperone                       2
Methylase                       1
Recombinase                     1
RhuM                            1
Prophage antirepressor          1
YckC                            1
Helicase                        1
Name: count, dtype: int64
Exporting Results for Important Phage Functions
Filtered tables of important WO phage functions are saved for further reporting in Figure 2.
# Filter merged_df to keep only rows for major WO phage functions.
df_cel = merged_df.loc[merged_df['Name'].isin(['Head', 'Tail', 'Tail fiber', 'Connector/baseplate', 'Replication/repair'])]
# Sort df_cel by function name, drop unnecessary columns, and display the result.
df_cel = df_cel.sort_values('Name')
df_cel = df_cel.drop(['WOPip_number_sequence', 'rowname', 'Value', 'Copies'], axis=1)
df_cel = df_cel.drop(df_cel.columns[14:23], axis=1)
df_cel
| gene_cluster_id | genome_name | nb_copies_in_WO_description | nb_copies_in_PipPel | nb_copies_in_JHB | nb_copies_in_PipMol | nb_copies_in_CelG3 | CelG3_id | WOseq_id | wo_name | ... | predicted_nb_copies_in_CelG3 | gene_callers_id | start | stop | wo_length | orientation | COG | Name | Product | manually_named | |
|---|---|---|---|---|---|---|---|---|---|---|---|---|---|---|---|---|---|---|---|---|---|
| 7 | GC_00000020 | CelG3 | 5 | 5 | 5 | 2 | 4 | 1188 | 11 | WOPip1 | ... | 9 | 1188 | 7218 | 7715 | 498 | - | NaN | Connector/baseplate | NaN | gpZ tail protein - Connector 2 |
| 24 | GC_00000033 | CelG3 | 4 | 4 | 3 | 3 | 3 | 1192 | 7 | WOPip1 | ... | 6 | 1192 | 5702 | 6037 | 336 | - | COG3628 | Connector/baseplate | Phage baseplate assembly protein W (PDB:2IA7) | gpW - Connector 6 |
| 16 | GC_00000028 | CelG3 | 4 | 4 | 4 | 3 | 3 | 1470 | 6 | WOPip1 | ... | 7 | 1470 | 4908 | 5699 | 792 | - | COG3948 | Connector/baseplate | Phage-related baseplate assembly protein (PDB:... | gpJ - Connector 7 |
| 14 | GC_00000034 | CelG3 | 4 | 4 | 3 | 2 | 4 | 1187 | 12 | WOPip1 | ... | 7 | 1187 | 7717 | 8022 | 306 | - | NaN | Connector/baseplate | NaN | gpFII - Connector 1 |
| 13 | GC_00000017 | CelG3 | 5 | 5 | 4 | 4 | 4 | 1191 | 8 | WOPip1 | ... | 7 | 1191 | 6040 | 6294 | 255 | - | COG4104 | Connector/baseplate | Zn-binding Pro-Ala-Ala-Arg (PAAR) domain, invo... | PAAR - Connector 5 |
| 20 | GC_00000018 | CelG3 | 5 | 5 | 4 | 4 | 4 | 1189 | 10 | WOPip1 | ... | 7 | 1189 | 6745 | 7221 | 477 | - | NaN | Connector/baseplate | NaN | Collar - Connector 3 |
| 10 | GC_00000016 | CelG3 | 5 | 5 | 4 | 4 | 4 | 1190 | 9 | WOPip1 | ... | 8 | 1190 | 6294 | 6758 | 465 | - | COG4540 | Connector/baseplate | Phage P2 baseplate assembly protein gpV (gpV) ... | gpV - Connector 4 |
| 41 | GC_00000013 | CelG3 | 4 | 4 | 5 | 6 | 5 | 1194 | 22 | WOPip2 | ... | 4 | 1194 | 21644 | 22804 | 1161 | + | COG4385 | Connector/baseplate | Bacteriophage P2-related tail formation protei... | gpI - Connector 8 |
| 11 | GC_00000009 | CelG3 | 5 | 6 | 6 | 4 | 7 | 1211 | 20 | WOPip4 | ... | 8 | 1211 | 23626 | 24687 | 1062 | - | COG0616 | Head | Periplasmic serine protease, ClpP class (SppA)... | ClpP/Minor capsid protein - Head Protein 4 |
| 15 | GC_00000011 | CelG3 | 4 | 6 | 7 | 3 | 6 | 1181 | 18 | WOPip1 | ... | 7 | 1181 | 12342 | 14177 | 1836 | - | COG5525 | Head | Phage terminase, large subunit GpA (gpA1) | gpA terminase - Head Protein 1 |
| 9 | GC_00000023 | CelG3 | 5 | 5 | 4 | 2 | 4 | 1186 | 13 | WOPip1 | ... | 8 | 1186 | 8120 | 9124 | 1005 | - | NaN | Head | NaN | Major capsid protein - Head Protein 6 |
| 23 | GC_00000008 | CelG3 | 4 | 7 | 8 | 3 | 8 | 1183 | 16 | WOPip1 | ... | 6 | 1183 | 10709 | 12127 | 1419 | - | COG5511 | Head | Phage capsid protein | Portal/Phage capsid protein - Head Protein 3 v... |
| 8 | GC_00000022 | CelG3 | 4 | 5 | 4 | 2 | 5 | 1182 | 17 | WOPip1 | ... | 8 | 1182 | 12128 | 12352 | 225 | - | NaN | Head | NaN | gpW assembly protein - Head Protein 2 |
| 70 | GC_00000191 | CelG3 | 1 | 1 | 1 | 0 | 1 | 1210 | 21 | WOPip4 | ... | 2 | 1210 | 24702 | 25922 | 1221 | - | COG5511 | Head | Phage capsid protein | Portal/Phage capsid protein - Head Protein 3 v... |
| 12 | GC_00000015 | CelG3 | 5 | 5 | 3 | 4 | 6 | 1185 | 14 | WOPip1 | ... | 8 | 1185 | 9150 | 9521 | 372 | - | NaN | Head | NaN | Head decoration protein D - Head Protein 5 |
| 47 | GC_00000091 | CelG3 | 2 | 2 | 0 | 1 | 1 | 1451 | 28 | WOPip1 | ... | 4 | 1451 | 25606 | 26100 | 495 | + | COG1595 | Replication/repair | DNA-directed RNA polymerase specialized sigma ... | Sigma-70 RNA Pol - WOPip1/2 |
| 81 | GC_00000173 | CelG3 | 1 | 1 | 1 | 1 | 1 | 1371 | 24 | WOPip1 | ... | 2 | 1371 | 19517 | 20935 | 1419 | - | COG1672 | Replication/repair | Predicted ATPase, archaeal AAA+ ATPase superfa... | ATPase - WOPip1 |
| 66 | GC_00000029 | CelG3 | 4 | 3 | 5 | 3 | 3 | 1407 | 37 | WOPip5 | ... | 2 | 1407 | 50801 | 51625 | 825 | - | NaN | Replication/repair | NaN | Membrane ATP-bind - WOPip1/2/4/5 |
| 65 | GC_00000077 | CelG3 | 1 | 1 | 3 | 1 | 1 | 1410 | 40 | WOPip5 | ... | 3 | 1410 | 53564 | 55678 | 2115 | - | COG0358 | Replication/repair | DNA primase (bacterial type) (DnaG) (PDB:3B39)... | DnaG and NTPase - WOPip5 ver. 2 |
| 62 | GC_00000122 | CelG3 | 1 | 1 | 1 | 1 | 1 | 1408 | 38 | WOPip5 | ... | 3 | 1408 | 51686 | 52210 | 525 | - | NaN | Replication/repair | NaN | Sigma-70 RNA Pol - WOPip5 |
| 60 | GC_00000055 | CelG3 | 1 | 1 | 7 | 1 | 1 | 1404 | 34 | WOPip5 | ... | 3 | 1404 | 47647 | 49395 | 1749 | - | COG0358 | Replication/repair | DNA primase (bacterial type) (DnaG) (PDB:3B39)... | DnaG and NTPase - WOPip5 ver. 1 |
| 50 | GC_00000031 | CelG3 | 4 | 4 | 4 | 3 | 3 | 1452 | 3 | WOPip2 | ... | 4 | 1452 | 1586 | 3391 | 1806 | + | COG0358 | Replication/repair | DNA primase (bacterial type) (DnaG) (PDB:3B39)... | DnaG and NTPase - WOPip12 |
| 102 | GC_00000117 | CelG3 | 1 | 1 | 1 | 1 | 1 | 1203 | 28 | WOPip4 | ... | 1 | 1203 | 36546 | 37046 | 501 | + | NaN | Replication/repair | NaN | Sigma-70 RNA Pol - WOPip4 |
| 92 | GC_00000092 | CelG3 | 1 | 1 | 1 | 2 | 1 | 1204 | 27 | WOPip4 | ... | 1 | 1204 | 34454 | 36511 | 2058 | + | COG0358 | Replication/repair | DNA primase (bacterial type) (DnaG) (PDB:3B39)... | DnaG and NTPase - WOPip4 |
| 30 | GC_00000026 | CelG3 | 3 | 3 | 6 | 4 | 3 | 1406 | 30 | WOPip1 | ... | 6 | 1406 | 26999 | 27805 | 807 | + | COG0358 | Replication/repair | DNA primase (bacterial type) (DnaG) (PDB:3B39)... | RepA Helicase - WOPip1/4/5 |
| 46 | GC_00000062 | CelG3 | 2 | 2 | 4 | 1 | 1 | 1388 | 41 | WOPip4 | ... | 4 | 1388 | 48057 | 48563 | 507 | + | COG3498 | Tail | Phage tail tube protein FII (PDB:3J9Q) (PUBMED... | Tail tube protein - Tail Protein 2 |
| 54 | GC_00000036 | CelG3 | 2 | 2 | 4 | 4 | 5 | 1386 | 20 | WOPip5 | ... | 3 | 1386 | 34301 | 36592 | 2292 | - | COG5283 | Tail | Phage-related tail protein | Tail tape measure protein - Tail Protein 4 |
| 56 | GC_00000021 | CelG3 | 4 | 4 | 8 | 4 | 1 | 1385 | 44 | WOPip4 | ... | 3 | 1385 | 51234 | 51590 | 357 | + | COG3499 | Tail | Phage protein U | gpUX tail assembly - Tail Protein 5-6 |
| 63 | GC_00000046 | CelG3 | 2 | 2 | 4 | 2 | 3 | 1487 | 21 | WOPip5 | ... | 3 | 1487 | 36702 | 36959 | 258 | - | NaN | Tail | NaN | gpG/gpGT chaperone - Tail Protein 3 |
| 27 | GC_00000051 | CelG3 | 2 | 2 | 4 | 2 | 2 | 1303 | 17 | WOPip5 | ... | 6 | 1303 | 32803 | 33747 | 945 | - | COG3500 | Tail | Phage protein D (gpD) | gpD/late control - Tail Protein 7 |
| 44 | GC_00000061 | CelG3 | 2 | 2 | 4 | 1 | 1 | 1389 | 40 | WOPip4 | ... | 4 | 1389 | 46863 | 48041 | 1179 | + | COG3497 | Tail | Phage tail sheath protein FI (PDB:3J9Q) (PUBME... | Tail sheath protein - Tail Protein 1 |
| 38 | GC_00000059 | CelG3 | 2 | 2 | 4 | 1 | 1 | 1390 | 39 | WOPip4 | ... | 5 | 1390 | 46319 | 46870 | 552 | + | NaN | Tail fiber | NaN | Tail fiber assembly - Tail Fiber 6 |
| 35 | GC_00000014 | CelG3 | 3 | 3 | 9 | 1 | 8 | 1394 | 30 | WOPip5 | ... | 5 | 1394 | 42595 | 44520 | 1926 | - | NaN | Tail fiber | NaN | DUF4815 - Tail Fiber 2 |
| 33 | GC_00000038 | CelG3 | 2 | 2 | 5 | 2 | 4 | 1199 | 32 | WOPip4 | ... | 5 | 1199 | 39545 | 40228 | 684 | + | NaN | Tail fiber | NaN | GP105 - Tail Fiber 1 |
| 32 | GC_00000060 | CelG3 | 2 | 2 | 4 | 1 | 1 | 1393 | 36 | WOPip4 | ... | 5 | 1393 | 43510 | 44727 | 1218 | + | NaN | Tail fiber | NaN | Lectin-like - Tail Fiber 3 |
| 25 | GC_00000058 | CelG3 | 2 | 2 | 4 | 1 | 1 | 1392 | 37 | WOPip4 | ... | 6 | 1392 | 44732 | 44926 | 195 | + | NaN | Tail fiber | NaN | DUF2730 - Tail Fiber 4 |
| 34 | GC_00000048 | CelG3 | 2 | 2 | 5 | 2 | 1 | 1391 | 38 | WOPip4 | ... | 5 | 1391 | 44923 | 46296 | 1374 | + | NaN | Tail fiber | NaN | Factor H-bind - Tail Fiber 5 |
37 rows × 22 columns
# Save the filtered and cleaned DataFrame of important WO phage functions to CSV.
df_cel.to_csv('Cel_WO_important_functions.csv')