RosaBioinfo
Coverage calculation at gene cluster-level for alignment of Isolate reads and SLAB reads on wPipSLAB
January 9, 2026
Maxime Mahout
Table of Contents
- Coverage calculation at gene cluster-level for alignment of Isolate reads and SLAB reads on wPipSLAB
- Load gene cluster summary
- Get gene clusters present in each reference genome for generating Venn diagrams
- Get gene calling IDs and start stop positions for coverage retrieval
- Get gene clusters associated to wPipSLAB gene calling IDs
- Retrieve SLAB coverage according to gene start and stop positions
- Retrieve Isolate coverage according to gene start and stop positions
- Aggregate gene cluster coverage using sum and mean
- Replace previous items data by new complete items data
Language: Python
Load gene cluster summary
The following input is required: Data/ISOLATE_PAN_gene_clusters_summary.txt.
import pandas

df = pandas.read_csv('Data/ISOLATE_PAN_gene_clusters_summary.txt', sep='\t', index_col=0)

df
| gene_cluster_id | bin_name | genome_name | gene_callers_id | num_genomes_gene_cluster_has_hits | num_genes_in_gene_cluster | max_num_paralogs | SCG | functional_homogeneity_index | geometric_homogeneity_index | combined_homogeneity_index | aa_sequence | |
|---|---|---|---|---|---|---|---|---|---|---|---|---|
| unique_id | ||||||||||||
| 1 | GC_00000001 | Confirmed | Isolate1 | 14 | 5 | 79 | 40 | 0 | 0.669271 | 0.667309 | 0.668288 | -----------MSQKV-------VNRTTGLVD-----YK-------... |
| 2 | GC_00000001 | Confirmed | Isolate1 | 57 | 5 | 79 | 40 | 0 | 0.669271 | 0.667309 | 0.668288 | -----------MSQKI-------ANRTTGLVD-----YK-------... |
| 3 | GC_00000001 | Confirmed | Isolate1 | 59 | 5 | 79 | 40 | 0 | 0.669271 | 0.667309 | 0.668288 | -----------MSQKI-------VNRTNGLVD-----YK-------... |
| 4 | GC_00000001 | Confirmed | Isolate1 | 13 | 5 | 79 | 40 | 0 | 0.669271 | 0.667309 | 0.668288 | -MTPRDREGSFEPQIV-------KKRQTNLHP--------------... |
| 5 | GC_00000001 | Confirmed | Isolate1 | 58 | 5 | 79 | 40 | 0 | 0.669271 | 0.667309 | 0.668288 | ---MKFWLGVLNDLKERGVEDILIACVDGLKS-----FPAAINSVF... |
| ... | ... | ... | ... | ... | ... | ... | ... | ... | ... | ... | ... | ... |
| 3119 | GC_00001139 | Confirmed | PipSLAB | 535 | 1 | 1 | 1 | 0 | 1.000000 | 1.000000 | 1.000000 | MVESKRIKVSSDMIINAVIDLSHWNENINFKLAREDGILGVIHKAT... |
| 3120 | GC_00001140 | Confirmed | PipPel | 375 | 1 | 1 | 1 | 0 | 1.000000 | 1.000000 | 1.000000 | MSEVSTNVQYTDGLGDKWLERELKHVNLGDTRLNKRLIKTGYCIEG... |
| 3121 | GC_00001141 | Outliers | WOPip5 | 39 | 1 | 1 | 1 | 0 | 1.000000 | 1.000000 | 1.000000 | MVYKRSLVQGSIIDLKVVESFKNAIVSHLFFFIQFKYLSNIFVVFL... |
| 3122 | GC_00001142 | Confirmed | PipPel | 407 | 1 | 1 | 1 | 0 | 1.000000 | 1.000000 | 1.000000 | MLNNVTRSQRSFLRKCALVIITALFLTLVLYSSLDKITNRFNYYFT... |
| 3123 | GC_00001143 | Confirmed | PipSLAB | 592 | 1 | 1 | 1 | 0 | 1.000000 | 1.000000 | 1.000000 | MNRSLEEIKALVIDRIETPFTTWWRVLQK |
3123 rows × 12 columns
# Filter out gene clusters which are outliers
df = df.loc[df['bin_name'] == 'Confirmed'].reset_index()
Get gene clusters present in each reference genome for generating Venn diagrams
with open('Output/gene_clusters_PipPel.txt', 'w') as f:
    print('\n'.join(list(df.loc[df['genome_name'] == 'PipPel']['gene_cluster_id'].unique())), file=f)
with open('Output/gene_clusters_Isolate1.txt', 'w') as f:
    print('\n'.join(list(df.loc[df['genome_name'] == 'Isolate1']['gene_cluster_id'].unique())), file=f)
with open('Output/gene_clusters_PipSLAB.txt', 'w') as f:
    print('\n'.join(list(df.loc[df['genome_name'] == 'PipSLAB']['gene_cluster_id'].unique())), file=f)
with open('Output/gene_clusters_WO1_5.txt', 'w') as f:
    print('\n'.join(list(df.loc[df['genome_name'].isin(['WOPip1', 'WOPip2', 'WOPip3', 'WOPip4', 'WOPip5'])]['gene_cluster_id'].unique())), file=f)
For use with InteractiVenn: https://link.springer.com/article/10.1186/s12859-015-0611-3
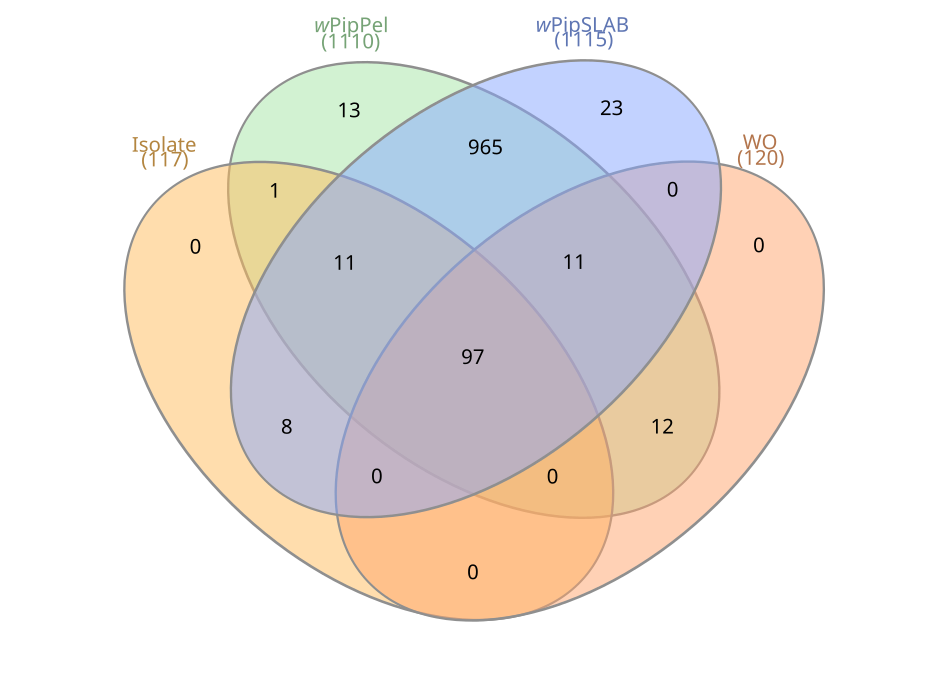
We also used the four outputs generated above in order to construct the Supplementary Table 2 Excel file.
Get gene calling IDs and start stop positions for coverage retrieval
The following input is required: Data/ISOLATE_PAN_GENE_CLUSTERS.fasta.
# Only read the fasta headers, interpreting '|' as separator and getting gene cluster information
head = pandas.read_csv('Data/ISOLATE_PAN_GENE_CLUSTERS.fasta', sep='|', header=None, skiprows=lambda x: x % 2 != 0)
head.head(12)
| 0 | 1 | 2 | 3 | |
|---|---|---|---|---|
| 0 | >00000000 | gene_cluster:GC_00000739 | genome_name:PipPel | gene_callers_id:523 |
| 1 | >00000001 | gene_cluster:GC_00000739 | genome_name:PipSLAB | gene_callers_id:891 |
| 2 | >00000002 | gene_cluster:GC_00000653 | genome_name:PipPel | gene_callers_id:766 |
| 3 | >00000003 | gene_cluster:GC_00000653 | genome_name:PipSLAB | gene_callers_id:379 |
| 4 | >00000004 | gene_cluster:GC_00000220 | genome_name:PipPel | gene_callers_id:890 |
| 5 | >00000005 | gene_cluster:GC_00000220 | genome_name:PipSLAB | gene_callers_id:266 |
| 6 | >00000006 | gene_cluster:GC_00000077 | genome_name:Isolate1 | gene_callers_id:35 |
| 7 | >00000007 | gene_cluster:GC_00000077 | genome_name:PipPel | gene_callers_id:1320 |
| 8 | >00000008 | gene_cluster:GC_00000077 | genome_name:PipPel | gene_callers_id:1375 |
| 9 | >00000009 | gene_cluster:GC_00000077 | genome_name:PipSLAB | gene_callers_id:72 |
| 10 | >00000010 | gene_cluster:GC_00000077 | genome_name:WOPip5 | gene_callers_id:47 |
| 11 | >00000011 | gene_cluster:GC_00000690 | genome_name:PipPel | gene_callers_id:471 |
head = head.drop(0, axis=1).rename({1: "gene_cluster", 2: "genome_name", 3: "gene_callers_id"}, axis=1).applymap(lambda x:x.split(':')[1])
header = head.copy()
The following input is required: Data/wSLAB002o.gff.
# Load SLAB.gff describing gene calls
SLAB = pandas.read_csv('Data/wSLAB002o.gff', sep='\t', header=None, skiprows=1)
SLAB
| 0 | 1 | 2 | 3 | 4 | 5 | 6 | 7 | 8 | |
|---|---|---|---|---|---|---|---|---|---|
| 0 | SLAB002_Cxq_ov_000000006904 | . | CDS | 230 | 1234 | . | - | . | ID=SLAB002_Cxq_ov_Wolbachia_contigs___0;Name=P... |
| 1 | SLAB002_Cxq_ov_000000006904 | . | CDS | 1537 | 2865 | . | - | . | ID=SLAB002_Cxq_ov_Wolbachia_contigs___1;Name=P... |
| 2 | SLAB002_Cxq_ov_000000006904 | . | CDS | 3063 | 3545 | . | + | . | ID=SLAB002_Cxq_ov_Wolbachia_contigs___2;Name=P... |
| 3 | SLAB002_Cxq_ov_000000006904 | . | CDS | 3731 | 5632 | . | + | . | ID=SLAB002_Cxq_ov_Wolbachia_contigs___3;Name=P... |
| 4 | SLAB002_Cxq_ov_000000006904 | . | CDS | 5645 | 6163 | . | + | . | ID=SLAB002_Cxq_ov_Wolbachia_contigs___4;Name=P... |
| ... | ... | ... | ... | ... | ... | ... | ... | ... | ... |
| 1276 | SLAB002_Cxq_ov_000000013131 | . | CDS | 3615 | 6884 | . | + | . | ID=SLAB002_Cxq_ov_Wolbachia_contigs___1276;Nam... |
| 1277 | SLAB002_Cxq_ov_000000013131 | . | CDS | 6944 | 7390 | . | - | . | ID=SLAB002_Cxq_ov_Wolbachia_contigs___1277;Nam... |
| 1278 | SLAB002_Cxq_ov_000000013131 | . | CDS | 7329 | 8342 | . | - | . | ID=SLAB002_Cxq_ov_Wolbachia_contigs___1278 |
| 1279 | SLAB002_Cxq_ov_000000013131 | . | CDS | 8350 | 8697 | . | - | . | ID=SLAB002_Cxq_ov_Wolbachia_contigs___1279;Nam... |
| 1280 | SLAB002_Cxq_ov_000000013131 | . | CDS | 8935 | 9954 | . | - | . | ID=SLAB002_Cxq_ov_Wolbachia_contigs___1280;Nam... |
1281 rows × 9 columns
SLAB['id'] = SLAB[8].str.split(';')
SLAB['id'] = SLAB['id'].apply(lambda x: x[0].split('=')[1].split('___')[1])
SLAB
| 0 | 1 | 2 | 3 | 4 | 5 | 6 | 7 | 8 | id | |
|---|---|---|---|---|---|---|---|---|---|---|
| 0 | SLAB002_Cxq_ov_000000006904 | . | CDS | 230 | 1234 | . | - | . | ID=SLAB002_Cxq_ov_Wolbachia_contigs___0;Name=P... | 0 |
| 1 | SLAB002_Cxq_ov_000000006904 | . | CDS | 1537 | 2865 | . | - | . | ID=SLAB002_Cxq_ov_Wolbachia_contigs___1;Name=P... | 1 |
| 2 | SLAB002_Cxq_ov_000000006904 | . | CDS | 3063 | 3545 | . | + | . | ID=SLAB002_Cxq_ov_Wolbachia_contigs___2;Name=P... | 2 |
| 3 | SLAB002_Cxq_ov_000000006904 | . | CDS | 3731 | 5632 | . | + | . | ID=SLAB002_Cxq_ov_Wolbachia_contigs___3;Name=P... | 3 |
| 4 | SLAB002_Cxq_ov_000000006904 | . | CDS | 5645 | 6163 | . | + | . | ID=SLAB002_Cxq_ov_Wolbachia_contigs___4;Name=P... | 4 |
| ... | ... | ... | ... | ... | ... | ... | ... | ... | ... | ... |
| 1276 | SLAB002_Cxq_ov_000000013131 | . | CDS | 3615 | 6884 | . | + | . | ID=SLAB002_Cxq_ov_Wolbachia_contigs___1276;Nam... | 1276 |
| 1277 | SLAB002_Cxq_ov_000000013131 | . | CDS | 6944 | 7390 | . | - | . | ID=SLAB002_Cxq_ov_Wolbachia_contigs___1277;Nam... | 1277 |
| 1278 | SLAB002_Cxq_ov_000000013131 | . | CDS | 7329 | 8342 | . | - | . | ID=SLAB002_Cxq_ov_Wolbachia_contigs___1278 | 1278 |
| 1279 | SLAB002_Cxq_ov_000000013131 | . | CDS | 8350 | 8697 | . | - | . | ID=SLAB002_Cxq_ov_Wolbachia_contigs___1279;Nam... | 1279 |
| 1280 | SLAB002_Cxq_ov_000000013131 | . | CDS | 8935 | 9954 | . | - | . | ID=SLAB002_Cxq_ov_Wolbachia_contigs___1280;Nam... | 1280 |
1281 rows × 10 columns
SLAB = SLAB.rename({3: 'start', 4: 'stop'}, axis=1)
SLAB['product'] = SLAB[8].str.split(';')
SLAB['product'] = SLAB['product'].apply(lambda x: x[3].split('=')[1] if len(x) > 3 else None)
SLAB = SLAB.rename({0: 'contig_name', 'id': 'gene_callers_id'}, axis=1)
SLAB = SLAB.drop([1, 2, 5, 6, 7, 8], axis=1)
Get gene clusters associated to wPipSLAB gene calling IDs
head = head.loc[head['genome_name'] == 'PipSLAB']
head
| gene_cluster | genome_name | gene_callers_id | |
|---|---|---|---|
| 1 | GC_00000739 | PipSLAB | 891 |
| 3 | GC_00000653 | PipSLAB | 379 |
| 5 | GC_00000220 | PipSLAB | 266 |
| 9 | GC_00000077 | PipSLAB | 72 |
| 12 | GC_00000690 | PipSLAB | 914 |
| ... | ... | ... | ... |
| 3114 | GC_00000260 | PipSLAB | 370 |
| 3116 | GC_00001017 | PipSLAB | 1055 |
| 3118 | GC_00000591 | PipSLAB | 683 |
| 3120 | GC_00000619 | PipSLAB | 39 |
| 3122 | GC_00001113 | PipSLAB | 911 |
1281 rows × 3 columns
SLAB
| contig_name | start | stop | gene_callers_id | product | |
|---|---|---|---|---|---|
| 0 | SLAB002_Cxq_ov_000000006904 | 230 | 1234 | 0 | Pyridine nucleotide-disulphide oxidoreductase |
| 1 | SLAB002_Cxq_ov_000000006904 | 1537 | 2865 | 1 | MnmE helical domain |
| 2 | SLAB002_Cxq_ov_000000006904 | 3063 | 3545 | 2 | 4Fe-4S binding domain |
| 3 | SLAB002_Cxq_ov_000000006904 | 3731 | 5632 | 3 | tRNA synthetase class II core domain (G H P ... |
| 4 | SLAB002_Cxq_ov_000000006904 | 5645 | 6163 | 4 | Translation initiation factor IF-3 C-terminal... |
| ... | ... | ... | ... | ... | ... |
| 1276 | SLAB002_Cxq_ov_000000013131 | 3615 | 6884 | 1276 | UvrD/REP helicase N-terminal domain |
| 1277 | SLAB002_Cxq_ov_000000013131 | 6944 | 7390 | 1277 | Cytochrome C biogenesis protein |
| 1278 | SLAB002_Cxq_ov_000000013131 | 7329 | 8342 | 1278 | None |
| 1279 | SLAB002_Cxq_ov_000000013131 | 8350 | 8697 | 1279 | 2Fe-2S iron-sulfur cluster binding domain |
| 1280 | SLAB002_Cxq_ov_000000013131 | 8935 | 9954 | 1280 | Ankyrin repeats (many copies) |
1281 rows × 5 columns
gc_df = SLAB.merge(head)
gc_df.head(12)
| contig_name | start | stop | gene_callers_id | product | gene_cluster | genome_name | |
|---|---|---|---|---|---|---|---|
| 0 | SLAB002_Cxq_ov_000000006904 | 230 | 1234 | 0 | Pyridine nucleotide-disulphide oxidoreductase | GC_00001040 | PipSLAB |
| 1 | SLAB002_Cxq_ov_000000006904 | 1537 | 2865 | 1 | MnmE helical domain | GC_00000306 | PipSLAB |
| 2 | SLAB002_Cxq_ov_000000006904 | 3063 | 3545 | 2 | 4Fe-4S binding domain | GC_00000215 | PipSLAB |
| 3 | SLAB002_Cxq_ov_000000006904 | 3731 | 5632 | 3 | tRNA synthetase class II core domain (G H P ... | GC_00000938 | PipSLAB |
| 4 | SLAB002_Cxq_ov_000000006904 | 5645 | 6163 | 4 | Translation initiation factor IF-3 C-terminal... | GC_00000880 | PipSLAB |
| 5 | SLAB002_Cxq_ov_000000006904 | 6186 | 7439 | 5 | Nuo51 FMN-binding domain | GC_00000620 | PipSLAB |
| 6 | SLAB002_Cxq_ov_000000006904 | 8106 | 9551 | 6 | MgtE intracellular N domain | GC_00000493 | PipSLAB |
| 7 | SLAB002_Cxq_ov_000000006904 | 9598 | 10041 | 7 | None | GC_00000521 | PipSLAB |
| 8 | SLAB002_Cxq_ov_000000006904 | 10136 | 10600 | 8 | None | GC_00000436 | PipSLAB |
| 9 | SLAB002_Cxq_ov_000000006904 | 10676 | 11068 | 9 | CcmE domain | GC_00000728 | PipSLAB |
| 10 | SLAB002_Cxq_ov_000000006904 | 11052 | 11189 | 10 | None | GC_00000597 | PipSLAB |
| 11 | SLAB002_Cxq_ov_000000006904 | 11186 | 12022 | 11 | Biotin/lipoate A/B protein ligase family | GC_00000946 | PipSLAB |
Retrieve SLAB coverage according to gene start and stop positions
The following input is required: Data/Coverage_SLAB002_Cxq_ov_filtered.txt.gz.
covdf = pandas.read_csv('Data/Coverage_SLAB002_Cxq_ov_filtered.txt', sep='\t', header=None)
covdf
| 0 | 1 | 2 | |
|---|---|---|---|
| 0 | SLAB002_Cxq_ov_000000000871 | 1 | 65 |
| 1 | SLAB002_Cxq_ov_000000000871 | 2 | 91 |
| 2 | SLAB002_Cxq_ov_000000000871 | 3 | 100 |
| 3 | SLAB002_Cxq_ov_000000000871 | 4 | 100 |
| 4 | SLAB002_Cxq_ov_000000000871 | 5 | 102 |
| ... | ... | ... | ... |
| 1344187 | SLAB002_Cxq_ov_000000041674 | 37736 | 19 |
| 1344188 | SLAB002_Cxq_ov_000000041674 | 37737 | 19 |
| 1344189 | SLAB002_Cxq_ov_000000041674 | 37738 | 19 |
| 1344190 | SLAB002_Cxq_ov_000000041674 | 37739 | 18 |
| 1344191 | SLAB002_Cxq_ov_000000041674 | 37740 | 14 |
1344192 rows × 3 columns
gene_cov = []
for i, row in gc_df.iterrows():
    gene_cov.append(covdf.loc[covdf[0] == row['contig_name']].loc[covdf[1] >= row['start']].loc[covdf[1] <= row['stop']][2].mean())
gc_df['slab_cov'] = gene_cov
Retrieve Isolate coverage according to gene start and stop positions
The following input is required: Data/Coverage_Isolate1-FILTERED_filtered.txt.gz.
covdf = pandas.read_csv('Data/Coverage_Isolate1-FILTERED_filtered.txt', sep='\t', header=None)
covdf
| 0 | 1 | 2 | |
|---|---|---|---|
| 0 | SLAB002_Cxq_ov_000000000871 | 1 | 0 |
| 1 | SLAB002_Cxq_ov_000000000871 | 2 | 0 |
| 2 | SLAB002_Cxq_ov_000000000871 | 3 | 0 |
| 3 | SLAB002_Cxq_ov_000000000871 | 4 | 4 |
| 4 | SLAB002_Cxq_ov_000000000871 | 5 | 4 |
| ... | ... | ... | ... |
| 1344187 | SLAB002_Cxq_ov_000000041674 | 37736 | 4 |
| 1344188 | SLAB002_Cxq_ov_000000041674 | 37737 | 4 |
| 1344189 | SLAB002_Cxq_ov_000000041674 | 37738 | 4 |
| 1344190 | SLAB002_Cxq_ov_000000041674 | 37739 | 4 |
| 1344191 | SLAB002_Cxq_ov_000000041674 | 37740 | 4 |
1344192 rows × 3 columns
gene_cov = []
for i, row in gc_df.iterrows():
    gene_cov.append(covdf.loc[covdf[0] == row['contig_name']].loc[covdf[1] >= row['start']].loc[covdf[1] <= row['stop']][2].mean())
gc_df['isolate_cov'] = gene_cov
gc_df
| contig_name | start | stop | gene_callers_id | product | gene_cluster | genome_name | slab_cov | isolate_cov | |
|---|---|---|---|---|---|---|---|---|---|
| 0 | SLAB002_Cxq_ov_000000006904 | 230 | 1234 | 0 | Pyridine nucleotide-disulphide oxidoreductase | GC_00001040 | PipSLAB | 322.235821 | 1.652736 |
| 1 | SLAB002_Cxq_ov_000000006904 | 1537 | 2865 | 1 | MnmE helical domain | GC_00000306 | PipSLAB | 376.499624 | 4.638074 |
| 2 | SLAB002_Cxq_ov_000000006904 | 3063 | 3545 | 2 | 4Fe-4S binding domain | GC_00000215 | PipSLAB | 342.983437 | 3.416149 |
| 3 | SLAB002_Cxq_ov_000000006904 | 3731 | 5632 | 3 | tRNA synthetase class II core domain (G H P ... | GC_00000938 | PipSLAB | 368.876972 | 1.996845 |
| 4 | SLAB002_Cxq_ov_000000006904 | 5645 | 6163 | 4 | Translation initiation factor IF-3 C-terminal... | GC_00000880 | PipSLAB | 413.204239 | 4.581888 |
| ... | ... | ... | ... | ... | ... | ... | ... | ... | ... |
| 1276 | SLAB002_Cxq_ov_000000013131 | 3615 | 6884 | 1276 | UvrD/REP helicase N-terminal domain | GC_00000858 | PipSLAB | 325.226911 | 2.699083 |
| 1277 | SLAB002_Cxq_ov_000000013131 | 6944 | 7390 | 1277 | Cytochrome C biogenesis protein | GC_00000270 | PipSLAB | 374.747204 | 2.201342 |
| 1278 | SLAB002_Cxq_ov_000000013131 | 7329 | 8342 | 1278 | None | GC_00000561 | PipSLAB | 371.595661 | 1.960552 |
| 1279 | SLAB002_Cxq_ov_000000013131 | 8350 | 8697 | 1279 | 2Fe-2S iron-sulfur cluster binding domain | GC_00000811 | PipSLAB | 310.735632 | 2.442529 |
| 1280 | SLAB002_Cxq_ov_000000013131 | 8935 | 9954 | 1280 | Ankyrin repeats (many copies) | GC_00000980 | PipSLAB | 351.721569 | 2.329412 |
1281 rows × 9 columns
gc_df.to_csv('Output/coverage_df_Isolate1_SLAB_against_SLAB.tsv', sep='\t')
Aggregate gene cluster coverage using sum and mean
sum_df_slab = pandas.DataFrame(gc_df.groupby('gene_cluster')['slab_cov'].sum())
mean_df_slab = pandas.DataFrame(gc_df.groupby('gene_cluster')['slab_cov'].mean())
sum_df_iso = pandas.DataFrame(gc_df.groupby('gene_cluster')['isolate_cov'].sum())
mean_df_iso = pandas.DataFrame(gc_df.groupby('gene_cluster')['isolate_cov'].mean())
sum_df_slab = sum_df_slab.rename({'slab_cov': 'slab_cov_sum'}, axis=1)
mean_df_slab = mean_df_slab.rename({'slab_cov': 'slab_cov_mean'}, axis=1)
sum_df_iso = sum_df_iso.rename({'isolate_cov': 'isolate_cov_sum'}, axis=1)
mean_df_iso = mean_df_iso.rename({'isolate_cov': 'isolate_cov_mean'}, axis=1)
items_df = pandas.concat([sum_df_slab, mean_df_slab, sum_df_iso, mean_df_iso], axis=1)
items_df
| slab_cov_sum | slab_cov_mean | isolate_cov_sum | isolate_cov_mean | |
|---|---|---|---|---|
| gene_cluster | ||||
| GC_00000001 | 16729.417577 | 576.876468 | 527.400503 | 18.186224 |
| GC_00000002 | 16667.476518 | 16667.476518 | 603.841924 | 603.841924 |
| GC_00000003 | 5102.531511 | 1020.506302 | 2499.940945 | 499.988189 |
| GC_00000004 | 3289.331410 | 657.866282 | 1856.092571 | 371.218514 |
| GC_00000005 | 4671.700809 | 778.616802 | 2359.419937 | 393.236656 |
| ... | ... | ... | ... | ... |
| GC_00001135 | 359.250000 | 359.250000 | 10.488889 | 10.488889 |
| GC_00001136 | 357.583567 | 357.583567 | 3.443511 | 3.443511 |
| GC_00001138 | 371.543210 | 371.543210 | 10.080247 | 10.080247 |
| GC_00001139 | 344.996899 | 344.996899 | 52.514729 | 52.514729 |
| GC_00001143 | 382.255556 | 382.255556 | 4.288889 | 4.288889 |
1115 rows × 4 columns
Replace previous items data by new complete items data
The following input is required: Data/ISOLATE_PAN_ITEMS.tsv.
# Get max_num_paralogs from old items data
old_items_data = pandas.read_csv('Data/ISOLATE_PAN_ITEMS.tsv', sep='\t')
for i, row in old_items_data.iterrows():
    items_df.loc[row['items'], 'single_copy'] = bool(row['max_num_paralogs'] == 1)
    items_df.loc[row['items'], 'ci_gene'] = False
cifs = ['10', '151', '152', '20', '21', '118', '119']
# Orthofinder found these Isolate1 proteins to contain cifA or cifB genes
header.loc[header['genome_name'] == 'Isolate1'].loc[header['gene_callers_id'].isin(cifs)]
| gene_cluster | genome_name | gene_callers_id | |
|---|---|---|---|
| 297 | GC_00000091 | Isolate1 | 152 |
| 376 | GC_00000090 | Isolate1 | 118 |
| 1370 | GC_00000089 | Isolate1 | 151 |
| 2316 | GC_00000046 | Isolate1 | 119 |
| 2317 | GC_00000046 | Isolate1 | 21 |
| 3050 | GC_00000071 | Isolate1 | 10 |
| 3051 | GC_00000071 | Isolate1 | 20 |
cid_gcs = list(header.loc[header['genome_name'] == 'Isolate1'].loc[header['gene_callers_id'].isin(cifs)]['gene_cluster'])
for cid_gc in cid_gcs:
    items_df.loc[cid_gc, 'ci_gene'] = True
items_df
| slab_cov_sum | slab_cov_mean | isolate_cov_sum | isolate_cov_mean | single_copy | ci_gene | |
|---|---|---|---|---|---|---|
| gene_cluster | ||||||
| GC_00000001 | 16729.417577 | 576.876468 | 527.400503 | 18.186224 | False | False |
| GC_00000002 | 16667.476518 | 16667.476518 | 603.841924 | 603.841924 | False | False |
| GC_00000003 | 5102.531511 | 1020.506302 | 2499.940945 | 499.988189 | False | False |
| GC_00000004 | 3289.331410 | 657.866282 | 1856.092571 | 371.218514 | False | False |
| GC_00000005 | 4671.700809 | 778.616802 | 2359.419937 | 393.236656 | False | False |
| ... | ... | ... | ... | ... | ... | ... |
| GC_00001134 | NaN | NaN | NaN | NaN | True | False |
| GC_00001137 | NaN | NaN | NaN | NaN | True | False |
| GC_00001140 | NaN | NaN | NaN | NaN | True | False |
| GC_00001141 | NaN | NaN | NaN | NaN | True | False |
| GC_00001142 | NaN | NaN | NaN | NaN | True | False |
1143 rows × 6 columns
items_df.to_csv('Output/ISOLATE_PAN_ITEMS_Isolate1_SLAB_against_SLAB.tsv', sep='\t')